Fits file here.
A smoothed PSF appropriate for a 10K source:
Fits file here.
A smoothed PSF appropriate for a 30K source:
Fits file here.
A smoothed PSF appropriate for a 1000K source:
Fits file here.
Observations of the asteroid Harmonia were analyzed and compared to STinyTim models to characterize the 160µm PSF and determine aperture corrections. This analysis is based on photometry-mode observations run through the MIPS DAT (v. 2.8), using a subsampling factor of x2 to generate the final mosaics. The prime purpose was to measure aperture corrections, so comparisons were performed using radial profiles of the observed and model PSFs, not detailed comparison of the 2D distribution of signal. (The analysis was not intended to generate model PSFs for use in deconvolution or PSF removal, but does probably provide useful insight into the types of PSF that might be appropriate for those uses.) The primary results are:
NOTE: The PSFs of concern here ARE NOT impacted by the near-IR spectral ghost. This report does not attempt to address the strength, position, or any other aspect of the spectral ghost, and its impact on photometry or imaging. Blackbody sources with temperatures in excess of 1000K are likely to be contaminated by the spectral ghost.
This page, all images, all fits images, and the routine used to compute the aperture corrections can be downloaded as a gzipped tarball here (~1Mb).
The main-belt asteroid Harmonia was observed in MIPS campaigns 10, 11, and 12 using the standard 160µm photometry AOR, and in campaign 11 using the large-field AOR. The data were reduced in the usual way using the DAT. The campaign X3 160µm illumination correction was used, no electronic non-linearity correction was applied, a subsampling factor of x2 (i.e. -s 0.5) was used to create the mosaics. An asteroid was used because there is no contamination of the PSF by the near-IR spectral ghost in the 160µm band.
The Campaign 11 (11MC) large-field mode PSF (top image in triptyche
below) was the truth image against which model PSF were compared.
While there appear to be some differences in the core of the PSF compared
to the 12MC small-field PSF (bottom image above), they are minor, as is
shown later.
| Figure 1: Observed and Model PSF Images | |
|---|---|
|
Harmonia Large-field mode observation from 11MC. The off-source DCEs have been subtracted from the on-source DCEs to remove time-varying detector effects. The slight NE/SW elongation of the PSF core may be related to a slight WCS issue in large-field mode. Fits file is here. |
|
The smoothed STinyTim PSF that best reproduces the radial profile
from the large-field observation above is for an 80K blackbody source: Fits file here. A smoothed PSF appropriate for a 10K source: Fits file here. A smoothed PSF appropriate for a 30K source: Fits file here. A smoothed PSF appropriate for a 1000K source: Fits file here. |
|
Harmonia small-field mode observation from 12MC. A constant background was removed from the final mosaic to simulate the near zero background obtained in the large-field mosaic. Fits file here. |
Radial profiles for the 11MC and STinyTim PSFs were computed and overplotted to
determine what model PSF to use for computing aperture corrections. The model PSF
is desireable because the total flux in the image is known exactly, there is no
noise, and there are no background sources or structure to cloud the results.
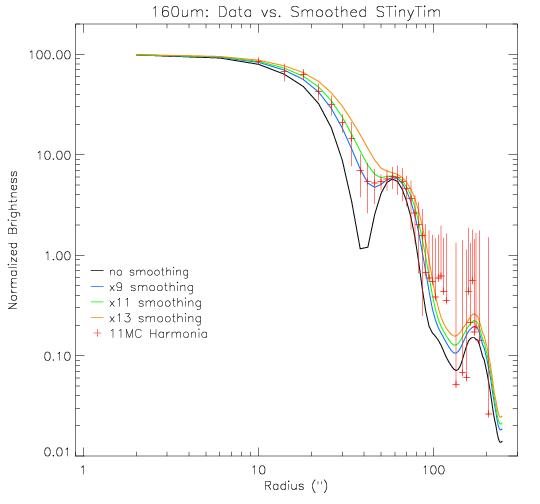
Figure 2 shows the radial profile from the observed PSF and profiles for various
degrees of smoothing of the STinyTim model PSF. The model PSF was computed for
blackbody spectra with temperatures of 1000, 80, and 10K. 1000K is about as hot
a blackbody source as can be observed without the near-IR spectral ghost contaminating
the PSF. Figure 2 shows results for the the 80K model profile. A point is plotted for
every pixel in the input images to show the range of values as a function of radial
distance. Distance in all cases is measured from the centroid of the PSF. Smoothing
of the STinyTim PSF was done using a boxcar of the specified width (the IDL smooth
function was used). The width is given in model PSF pixels, which were 3.2" on a side.
| Figure 2: Observed vs. Smoothed STinyTim Radial Profiles |
|---|
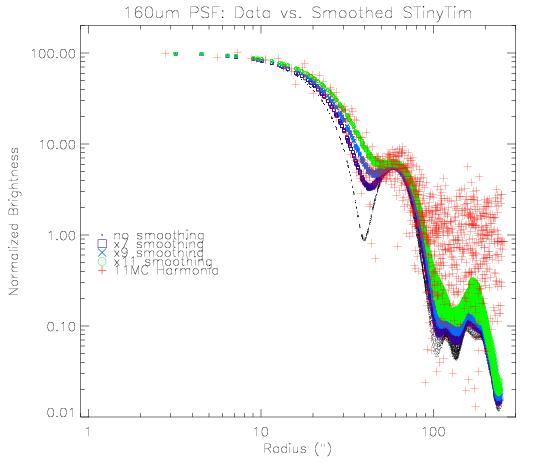 |
Figure 3 shows the same data as Figure 2, but average values within
radial bins are given. For the observed PSF error bars show the 1σ
deviation of the data falling within each bin. From this figure it
is clear that in the core of the PSF the data fall between the models
smoothed by 9 and 11 pixels. However, near the first Airy minimum the
observed PSF is much more closely approximated by the model PSF smoothed
by 9. Beyond the first Airy ring the x9 and x11 models are quite close,
and both agree with the data very well. On the basis of this figure,
a composite model PSF, constructed by averaging the x9 and x11 smoothed
model PSFs, was chosen as the basis for computing aperture corrections.
It should work well for apertures smaller than the first Airy minimum,
where it is most critical, and it makes little difference which model
is used for larger apertures.
| Figure 3: Observed vs. Smoothed STinyTim Average Radial Profiles |
|---|
 |
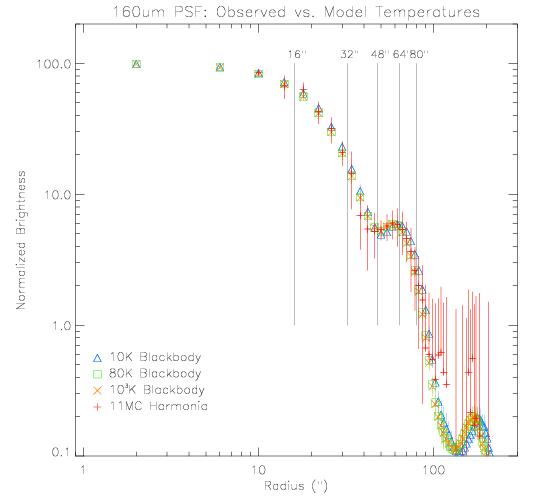
The effect of source temperature on the PSF is shown in Figure 4.
The hottest source considered is a 1000K blackbody, as sources hotter than
that will have a significant contribution from the near-IR spectral ghost.
The temperature of the observed asteroid was about 250K. As the figure shows,
a 250K blackbody is equivalent to a 1000K blackbody for the purposes of
aperture corrections. Vertical lines are labeled showing distance in the native
pixel scale of 16"/pix for comparison with the apertures defined in the results
section below.
| Figure 4: Effect of Temperature on Model PSFs |
|---|
 |
The aperture corrections were computed using the IDL astronomy library procedure aper.pro.
The aperture correcion is the total counts in the model image normalized by the counts in the
object - sky apertures. That is, to correct photometry done using one of the apertures defined
below, the user must multiply their measured counts by the aperture correction to derive the
total flux of the object. The effect of the source temperature is only 5.4% in the 20" aperture,
well below the absolute calibration of the 160µm data, and the effect is smaller for
larger apertures. Note that some of the combinations of object and sky apertures defined here
actually overlap, and so probably wouldn't be used in practice.
| 160µm Aperture Corrections | ||||||
|---|---|---|---|---|---|---|
| Background Annulus Radii | ||||||
| Aperture Description | Aperture Radius | None | first Airy ring | first Airy min. | large | |
| (arcseconds) | 32"-56" (2-3.5 pix) | 40"-75" (2.5-4.7 pix) | 75"-125" (4.7-7.8 pix) | |||
| 10K (red) source | ||||||
| 0.5 x HWHM | 10.000 | 10.083 | 10.663 | 10.718 | 10.094 | |
| 1 x HWHM | 20.000 | 3.124 | 3.350 | 3.372 | 3.128 | |
| 1.5 x HWHM | 30.000 | 1.931 | 2.130 | 2.150 | 1.935 | |
| 2 x HWHM | 40.000 | 1.601 | 1.857 | 1.884 | 1.605 | |
| center 1st Airy minimum | 50.000 | 1.470 | 1.833 | 1.875 | 1.476 | |
| 1000K (blue) source | ||||||
| 0.5 x HWHM | 10.000 | 9.381 | 10.003 | 9.960 | 9.389 | |
| 1 x HWHM | 20.000 | 2.962 | 3.215 | 3.197 | 2.966 | |
| 1.5 x HWHM | 30.000 | 1.874 | 2.110 | 2.093 | 1.877 | |
| 2 x HWHM | 40.000 | 1.575 | 1.891 | 1.866 | 1.579 | |
| center 1st Airy minimum | 50.000 | 1.437 | 1.886 | 1.848 | 1.442 | |
| An ASCII table with these (and others) is here. | ||||||