Simulated IOC Flatfields (24micron) and Illumination Corrections (70 and 160micron)
Almudena Alonso-Herrero, Steward Observatory
Date: Last revision - February 2003
PDF File here
ABSTRACT
This report presents results on the statistical quality of simulated flatfields (24micron) and ICs (70 and 160microns). The main differences with respect to John Stansberry's flatfield report are: i) We make use of simulated RAW datasets (produced using mips_simulator) which include photon noise. The datasets are reduced using the UofA pipeline (mips_sloper); ii)We make use of Herve Dole's newest simulations as released January 31st 2003. Previous simulations overestimated the number of sources at all three MIPS wavelengths; iii) We analyze the quality of simulated flatfields and ICs in terms of the zodi brightness and HI Galactic column density (cirrus); iv) We analyze the quality of simulated flatfields and ICs in terms of the observing mode: photometry mode and scan mode.
Dependence on observing mode (photometry vs. scan). At 24microns we find no statistical differences in the quality of flatfields obtained in photometry mode and scan mode for number of combined DCE > 60. At 70 and 160microns we find that in general ICs observed in scan mode are of equal or better quality than those obtained in photometry mode. Note that in John's report he found that at 160micron ICs obtained in scan mode had lower S/N. We find however that at 160microns there is a strong dependence on the cirrus component (see below), so a direct comparison between ICs obtained in photometry and scan mode is difficult because, according to the simulations, the cirrus structure changes on scales similar to the fields covered by the observations.
Dependence on the number of combined DCEs We find that our results on the statistical quality of simulated ICs (70 and 160microns) in terms of the number of combined DCEs are different from those in John Stansberry's report because Herve Dole's previous simulations of the sky overestimated the number of sources at all three wavelengths. At 24microns 60DCEs or more DCEs (depending on zodi brightness) will produce flatfields to better than 0.5%RMS for zodi brightness of 20, 30 and 40MJy/strd, and Galactic column densities of NH=1020atoms/cm2 and NH=1021atoms/cm2. At 70micron between 100DCEs and 200DCEs (depending on zodi brightness and Galactic column density) will produce ICs to better than 0.5%. The most complicated situation appears to be at 160microns, where we find that the number of DCEs required to produce an IC to better than 1% varies between 300 and 500DCEs depending on the zodi brightness and especially the cirrus component.
Dependence on the zodi brightness We have simulated flatfields for zodi brightness at 24micron of 20, 30 and 40MJy/sr (or zodi brightness at 70microns of 5.3, 8 and 10.6MJy/sr, or zodi brighness at 160microns of 0.9, 1.3 and 1.8MJy/sr) for Galactic HI column densities of log NH=20 and log NH=21. For the case of lowest zodi brightness at 24microns we find that 60DCEs -that is, number of DCEs observed every time a flatfield in photometry mode is obtained - will always produce a flatfield with RMS of 0.5%. Flatfields observed at higher zodi brightnesses will always produce RMS better than 0.5%. In scan mode we will observe ~118DCE which results in RMS of between 0.3% and 0.2% depending of the 24micron zodi brightness. At 70 and 160 microns higher zodi brightnesses also produce higher S/N Ics, but the main factor determining the quality of the ICs is the cirrus component (especially at 160micron).
Dependence on the Galactic column density (cirrus component). The effect of the cirrus component is most significant at 70 and 160microns, so extra care will be necessary when median combining DCEs. It may be required to throw away DCEs with a bright cirrus component when constructing Ics as they can significantly degrade the quality of the IC.
1. Introduction: Flatfields and ICs during IOC
Briefly, during IOC we will obtain routine Flatfields and IC using the two standard observing modes: photometry and scan. For a detailed description of the IOC flatfield/IC tasks we refer the reader to the IOC cookbooks of tasks MIPS-914, MIPS-915, MIPS-916, MIPS-917, MIPS-918 and MIPS-919.
In this report we will investigate the statistical quality of SIMULATED flatfields and ICs as a function of number of combined DCEs, Galactic column density and zodi brightness at 24micron -since we will try to use the same region of the sky to obtain flatfields and ICs at all three wavelengths.
There are a number of differences with respect to John Stansberry's flatfield report:
We make use of simulated RAW datasets (produced using mips_simulator) which include photon noise. The datasets are reduced using the UofA pipeline (mips_sloper).
We make use of Herve Dole's newest simulations as released January 31st 2003. Previous simulations overestimated the number of sources at all three MIPS wavelengths.
We analize the quality of simulated flatfields and ICs in terms of the zodi brightness and HI column density (cirrus).
We analyze the quality of simulated flatfields and ICs in terms of the observing mode: photometry mode and scan mode.
1.1 - Some notes on Herve Dole's simulations
The "normal" zodi SED at high ecliptic latitude is:
at 24microns: 27.30 MJy/sr
at 70microns: 7.29 MJy/sr
at 160microns: 1.21 MJy/sr
A fixed factor (ie the same at 24, 70 and 160) was applied to generate the maps with zodi brightnesses at 24microns of 20, 30 and 40MJy/sr. The conversion from Galactic HI column density (cirrus component), used the cirrus SED from Boulanger et al. A cirrus of NH=1020atoms/cm2 has a brightness
at 24microns: 0.03 MJy/sr
at 70microns: 0.12 MJy/sr
at 160microns: 1.5 MJy/sr
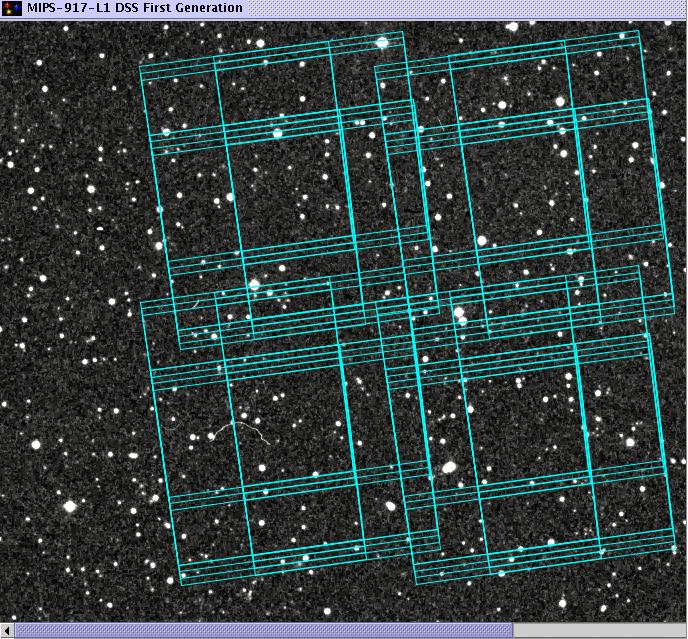
1.2 - 24micron Routine Photometry Flatfields
The IOC task to obtain Routine Flatfields in Photometry Mode is MIPS-917. A 4 point dither map (1 cycle) will be obtained at 24microns with 3 second DCEs in a region of the sky chosen to avoid bright point sources. The offsets between positions are 400 arcseconds. At each position of the dither pattern there will be 14 images, so a total of 56 images will be obtained each time the task is executed. The map will require about 10.3 minutes of observing time. This is the AOR file overlaid on the sky:
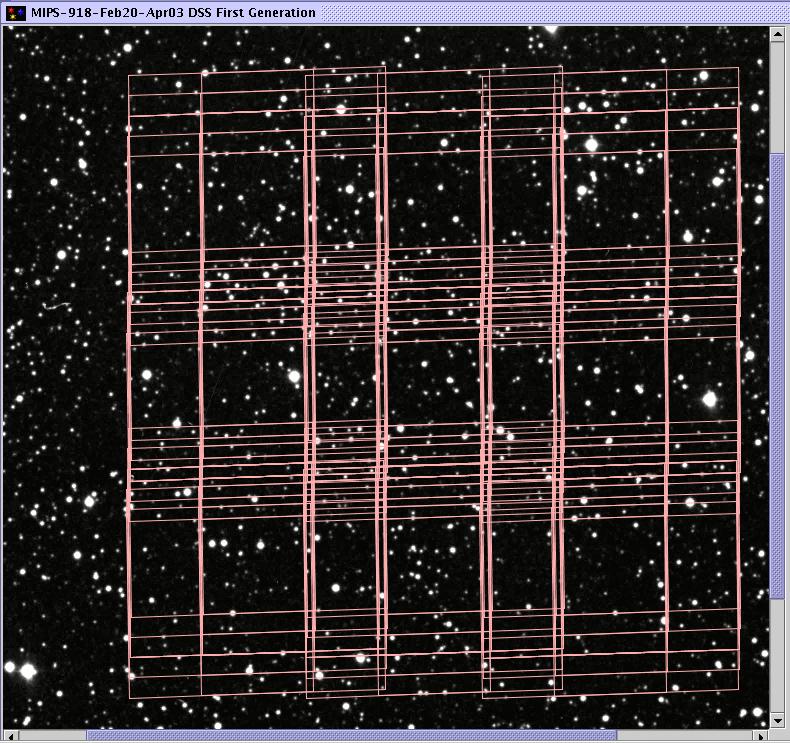
1.3 - 70micron Routine photometry ICs
The IOC task to obtain 70 micron IC in photometry mode is MIPS-918. A 3x3 square dither map (1 cycle) will be obtained at 70microns with 3 second DCEs in a region of the sky chosen to avoid bright point sources. The offsets are 300 arcseconds. At each position there will be 12 images, so a total of 108 images will be produced each time this task is excecuted. The map will require about 21.0 minutes of observing time. This is the AOR file overlaid on the sky:
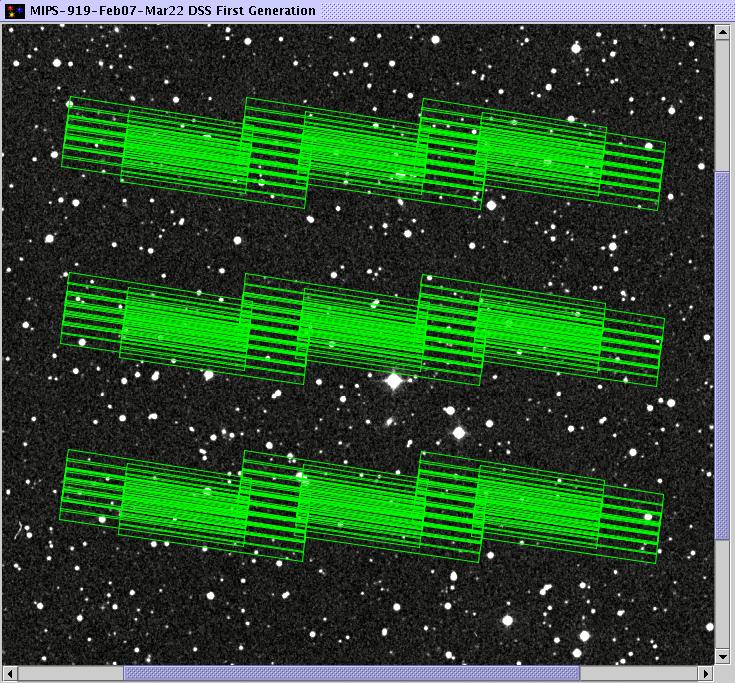
1.4 160micron Routine Photometry ICs
The IOC task to obtain 160 micron IC in photometry mode is MIPS-919. A 3x3 square dither map (1 cycle) will be obtained at 160micron with 3 second DCEs in a region of the sky chosen to avoid bright point sources. The offsets are 300 arcseconds. At each position there will be 12 images, so a total of 108 images will be obtained each time this task is executed. The map will require about 21.0 minutes of observing time. This is the AOR file overlaid on the sky:
1.5 24, 70 and 160micron Routine Scan Flatfields and ICs
A 2 degree long (1 leg) scan map will be obtained using the fast scan AOT in a region of the sky chosen to avoid bright point sources. This will produce a total of 118 images per wavelength to be median combined to produce flatfields and ICs. The map will require about 12.7 minutes of observing time. The IOC tasks are MIPS-914, MIPS-915 and MIPS-916.
2. Simulation of Flatfields and ICs: producing raw data and data reduction
This report presents results on the statistical quality of SIMULATED Flatfields and Illumination Corrections to be taken during IOC, as an extension of the report wrote by John Stansberry. The main differences with respect to the previous report are the following:
We used the latest Herve Dole's simulations (as of January 2003) of the sky at 24, 70 and 160microns with two different values of the column density: NH=1020atoms/cm2 and NH=1021atoms/cm2. We used three different 24micron zodi brightnesses to investigate the effect of the zodi brightness on the S/N of the flatfields:
20MJy/sr
30 MJy/sr
40 Mjy/sr
We used mips_simulator (includes photon noise) in conjunction with the AOR files (see cookbooks) to be used during IOC to simulate raw data at all three wavelengths. In particular we investigate the flatfields/ICs to be obtained in:
photometry mode. This shows how we simulated raw data at 24micron for one pointing in photometry mode.
mips_simulator -r -p -a 24 map_obslf_2048_0024_nh20.0.zodi20.fits flat-phot-24micron.aor -o flatzodi20_phot24_pos1
scan mode. This is an example of simulated scan data. Note that because the size of Herve's maps is 1.24x1.24 square degrees, the 2-degree scan maps had to be simulated in two steps:
mips_simulator -r -p -a 24 map_obslf_2048_0024_nh20.0.zodi20.fits flat-phot-24micron.aor -o flatzodi20_phot24_pos1
We did the data reduction using mips_sloper, eg, for 24micron data:
mips_sloper -oa -oc -b -d -l flatzodi20_phot24_pos10.24.raw.fits
and for 70micron data:
mips_sloper -l -oa -oc flatzodi20_phot70_pos10.70.raw.fits
At the time of the writing of this report we were not able to run mips_caler on the reduced data because of some missing keyword in the header regarding the stim flash frequency. We subtracted the dark images using imarith in IRAF
reduced DCEs were median combined (with sigma rejection) and normalized to unity to produce flatfields and illumination corrections using IRAF tasks imcombine and bscale
3. Results for Flatfields/ICs obtained in Photometry Mode
In what follows we show the dependence of the qualitiy of the flatfields/ICs obtained in photometry mode as a function of the number of DCEs and zodi brightness.
Results at 24micron
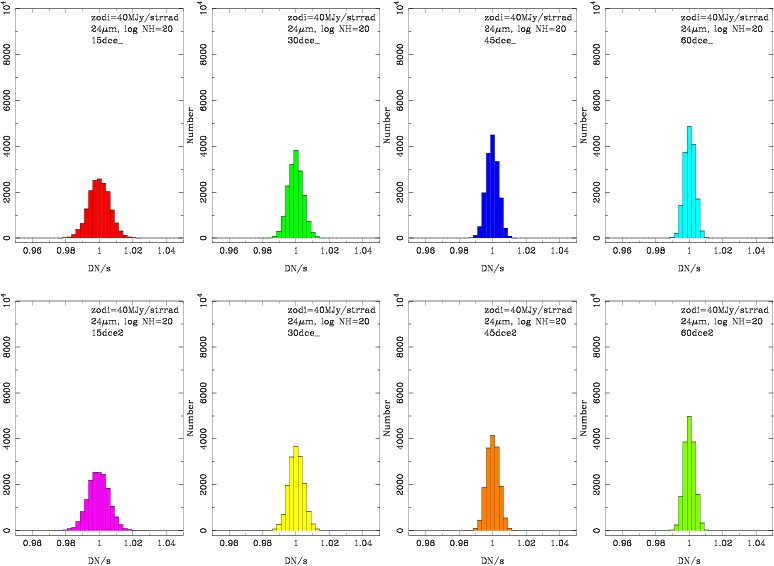
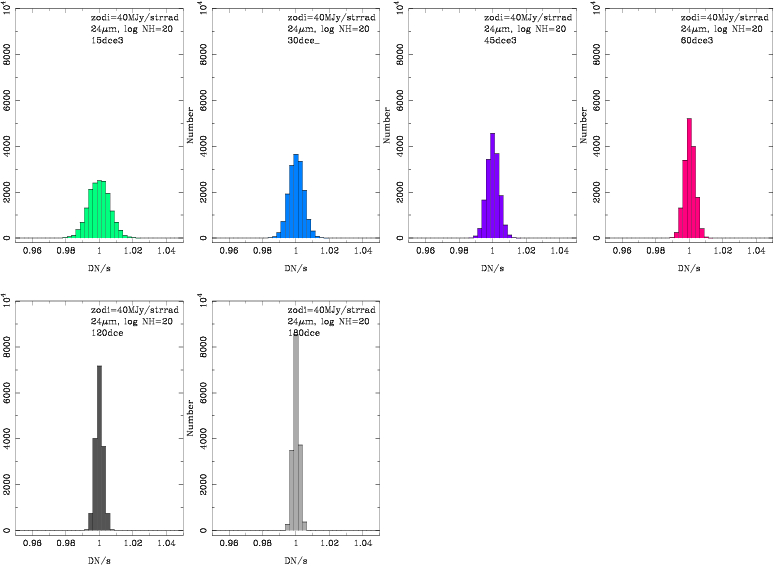
Figure 1: Histograms of simulated 24micron routine PHOTOMETRY MODE flatfields for zodi brightness=40MJy/sr, for different choices of fields (first top three panels, rightmost graphs=60DCEs, represent the case of executing the IOC task once). The bottom panel shows the combination of two (=120DCEs) and three (=180DCE) fields. Galactic Column Density NH=1020atoms/cm2.
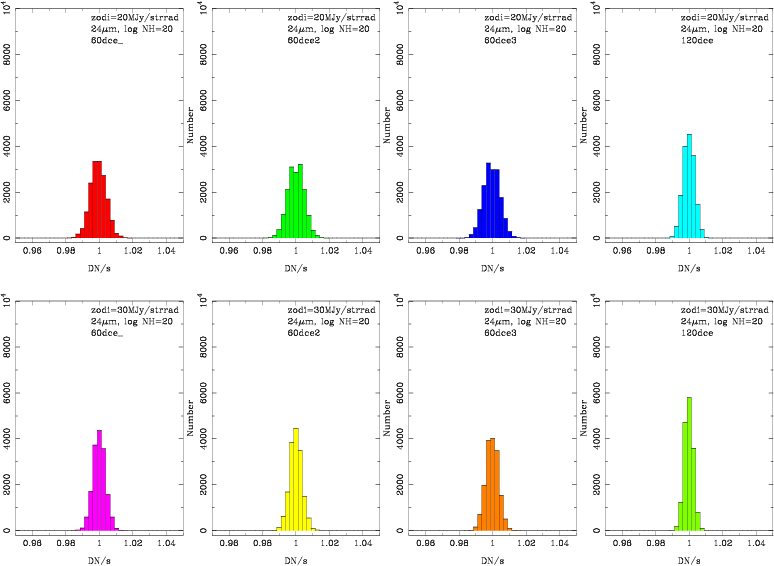
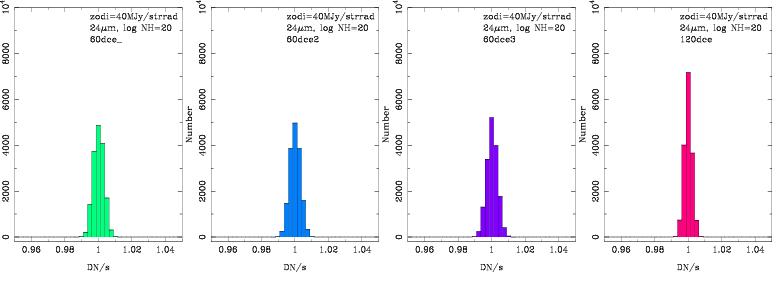
Figure 2: Effect of the zodi brightness (top panel=20MJy/sr, mid panel=30MJy/sr, bottom panel=40MJy/sr) on the S/N of different simulated flatfields obtained in PHOTOMETRY mode at 24micron. The three leftmost panels show flatfields constructed with 60DCEs, the rightmost panels are flatfields constructed with 120DCEs. Galactic Column Density NH=1020atoms/cm2.
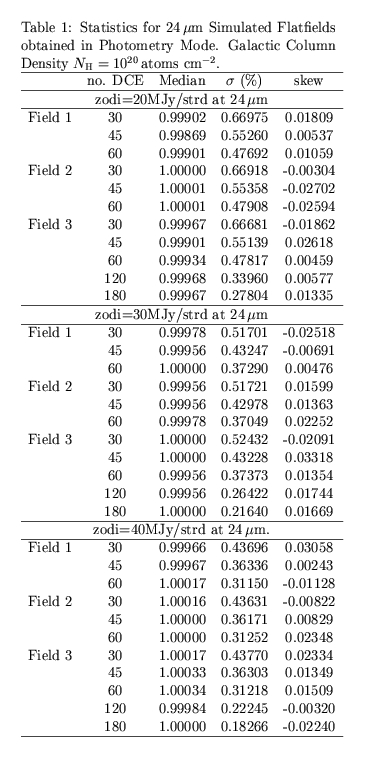
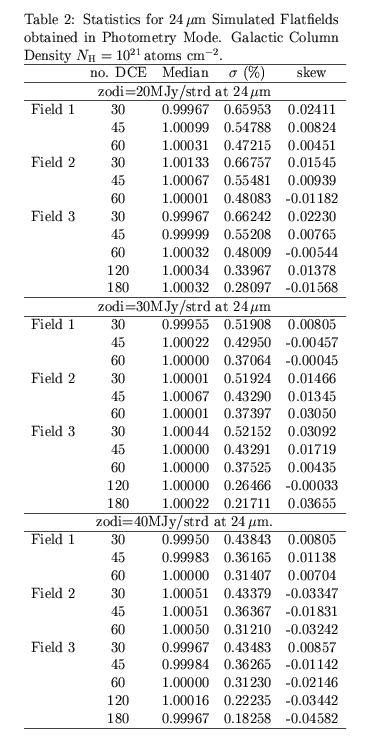
The following tables (Table1 and Table2) give the statistics of the simulated flatfields in photometry mode at 24microns as a function of number of DCEs, field and zodi brightness, where sigma is the standard deviation (in %) over the array, and skew is the skewness of the distribution of DN/s. Table 1 is for Galactic Column Density of NH=1020atoms/cm2 and Table 2 is for NH=1021atoms/cm2.
Results at 70micron
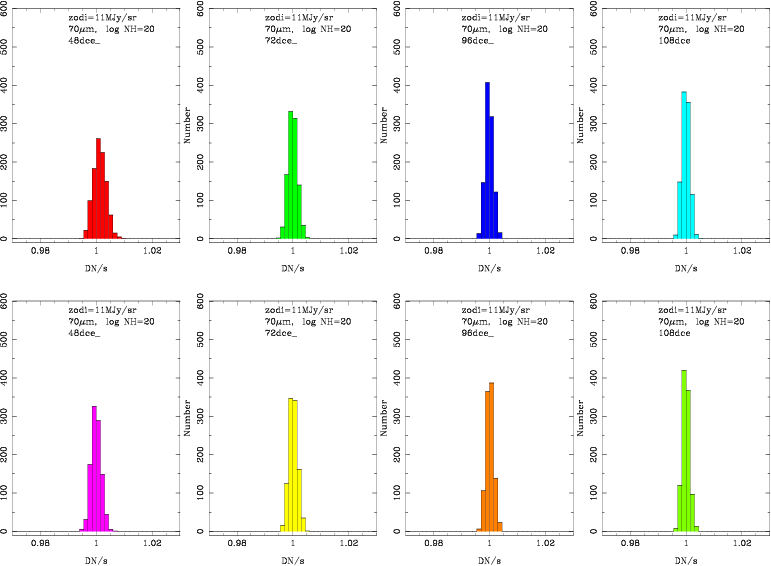
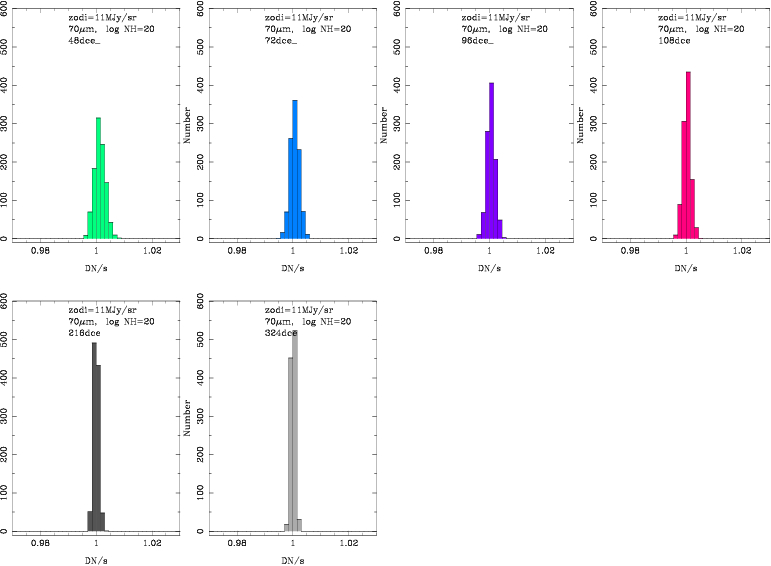
Figure 3: Histograms of simulated 70micron routine PHOTOMETRY mode ICs for zodi brightness(70micron)=11MJy/sr for different choices of fields (first three panels from top, rightmost graphs=108DCEs represent the case of executing the IOC task once). The bottom panel shows the combination of two (=216DCEs) and three (=324DCE) fields. Galactic Column Density NH=1020atoms/cm2.
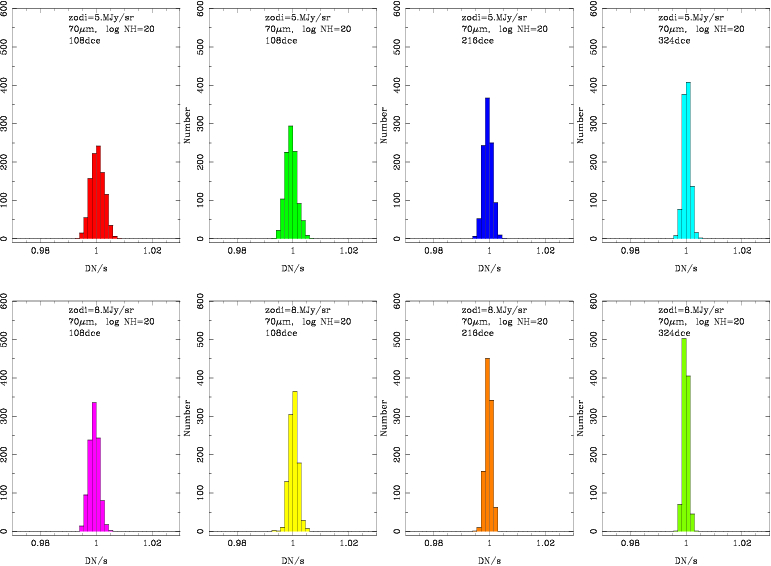
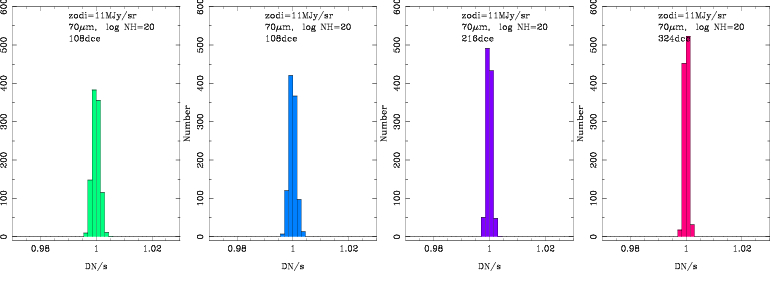
Figure4: Simulated 70micron ICs in PHOTOMETRY mode in terms of the zodi brightness (top panel=5.3MJy/sr, mid panel=8.MJy/sr, bottom panel=10.6MJy/sr). The two leftmost panels show flatfields constructed with 108DCEs (number of DCEs obtained everytime the task is executed for two different fields), the other panels are flatfields constructed combining 2 and 3 fields. Galactic Column Density NH=1020atoms/cm2.
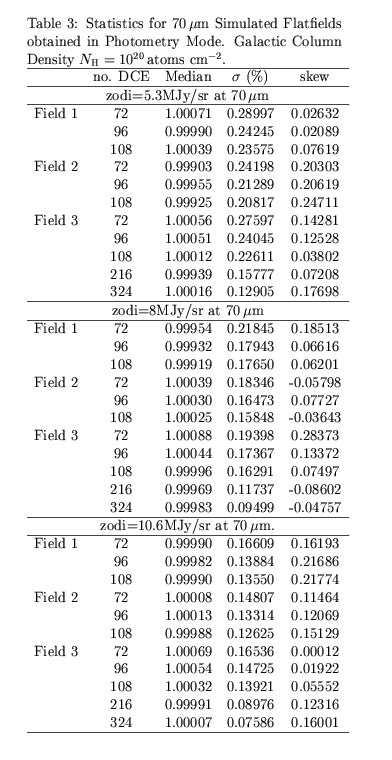
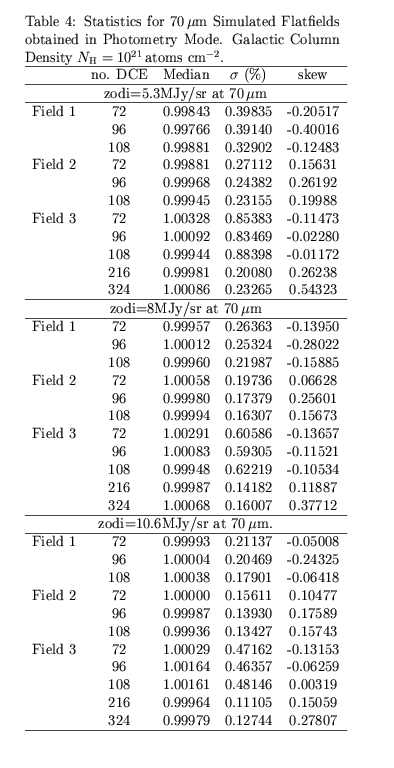
The following tables (Tables 3 and Table 4) give the statistics of the simulated ICs at 70microns in terms of number of DCEs, field used and zodi brightness, where sigma is the standard deviation (%) over the array, and skew is the skewness of the distribution of DN/s. Table 3 is for Galactic Column Density of NH=1020atoms/cm2 and Table 4 is for NH=1021atoms/cm2.
Results at 160micron
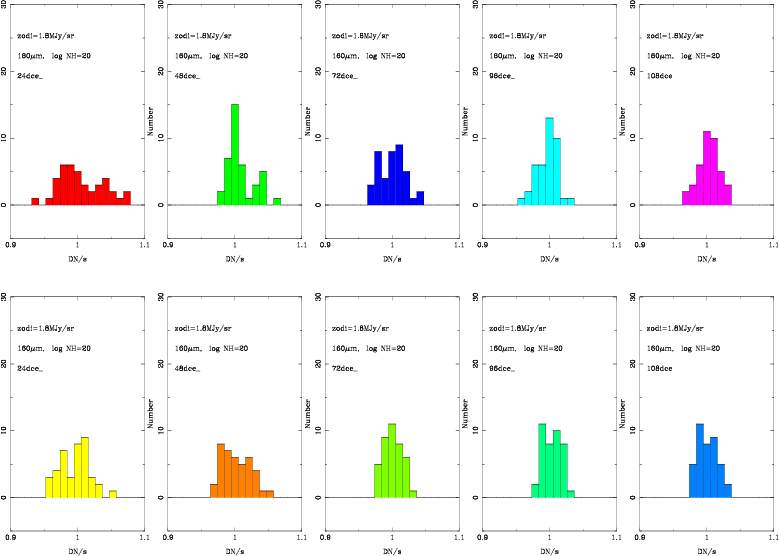
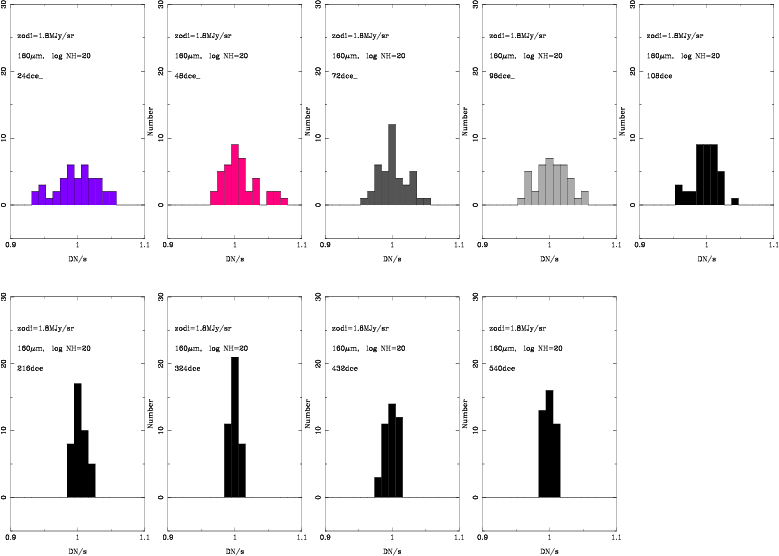
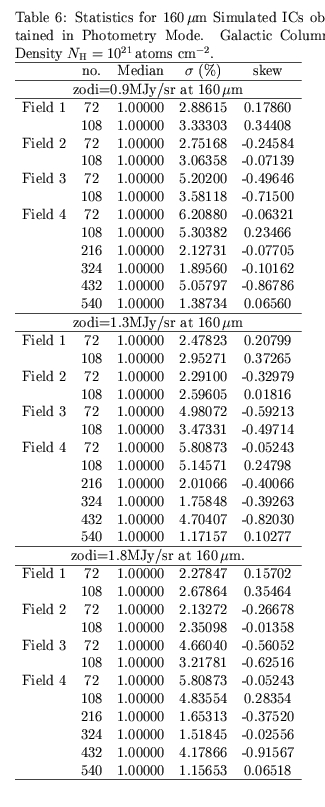
Figure 5: Histograms of simulated 160micron routine PHOTOMETRY IC for zodi brightness(160micron)=1.8MJy/sr, for different choices of fields (first three panels from top, rightmost graphs=108DCEs represent the case of executing the IOC task once). The bottom panel shows Ics constructed by combining two (=216DCEs), three (=324DCE), four (=432DCE) and five (=540DCE) fields. Galactic Column Density NH=1020atoms/cm2.
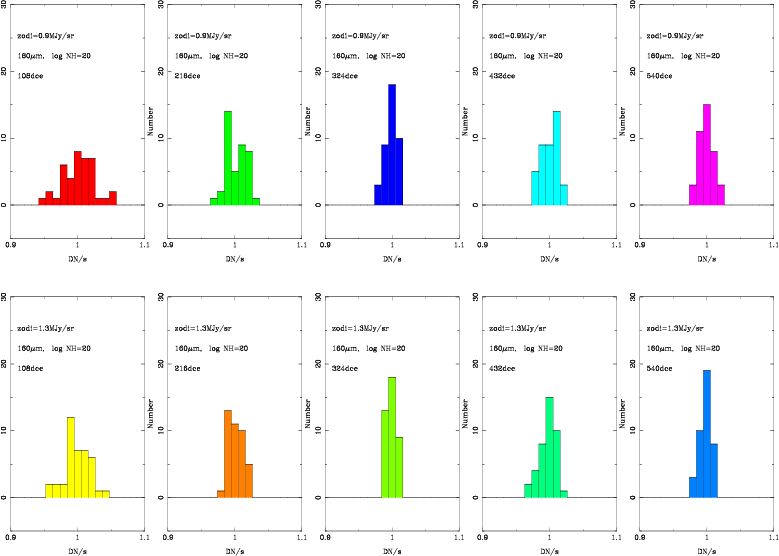
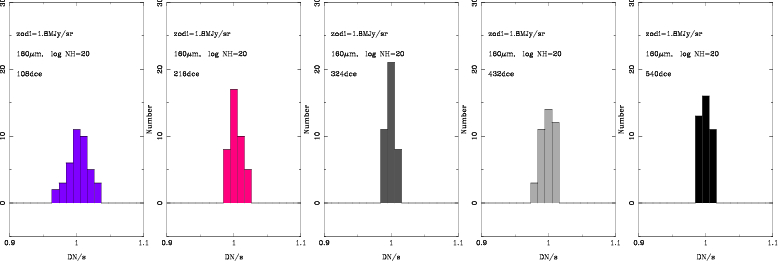
Figure6: Simulated 160micron ICs obtained in PHOTOMETRY as a function of the zodi brightness (top panel=0.9MJy/sr, mid panel=1.3MJy/sr, bottom panel=1.8MJy/sr). The leftmost panels show flatfields constructed with 108DCEs (number of DCEs obtained everytime the task is executed), the other panels are flatfields constructed combining 2, 3, 4 and 4 fields.Galactic Column Density NH=1020atoms/cm2.
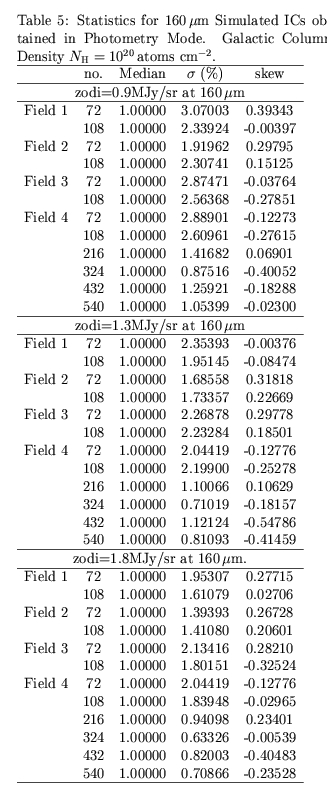
The following tables (Table5 and Table6) give the statistics of the simulated ICs at 160microns in terms of number of DCEs, field used and zodi brightness, where sigma is the standard deviation (%) over the array, and skew is the skewness of the distribution of DN/s. Table 5 is for Galactic Column Density of NH=1020atoms/cm2 and Table 6 is for NH=1021atoms/cm2.
4. Results for Flatfields/ICs obtained in Scan Mode
In what follows we show the dependence of the qualitiy of the flatfields/ICs obtained in scan mode as a function of the number of DCEs, zodi brightness and Galactic column density.
Results at 24micron
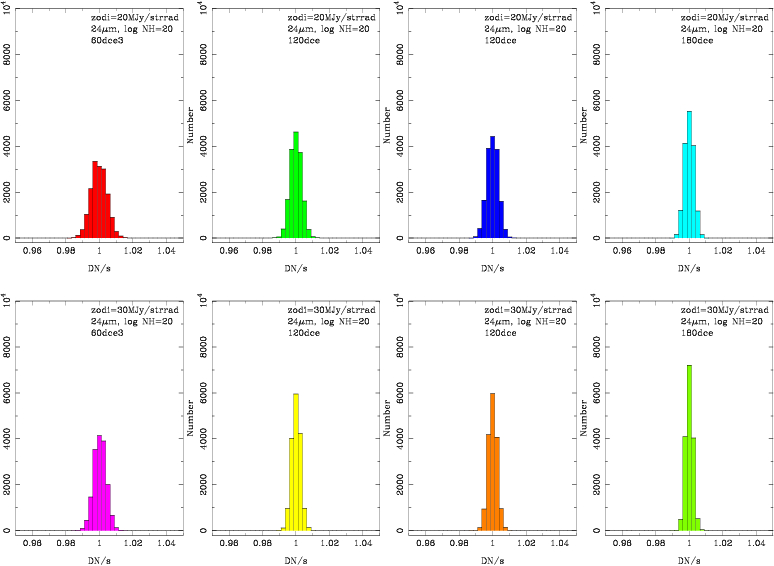
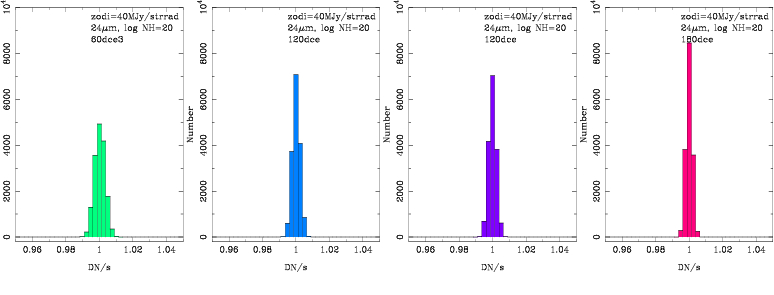
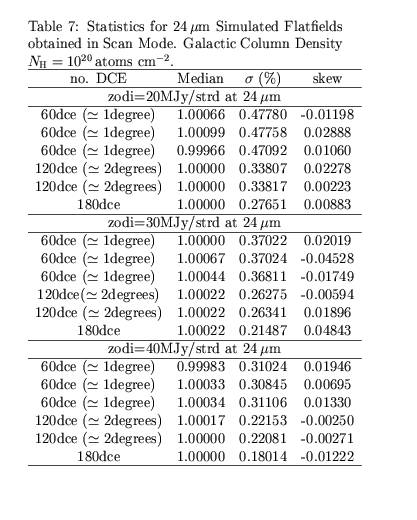
Figure 7: Simulated 24micron flatfields obtained in SCAN mode. This figures shows the effect of the zodi brightness (top panel=20MJy/sr, mid panel=30MJy/sr, bottom panel=40MJy/sr) and number of DCEs. A typical IOC flatfield observed in scan mode will be the result of median combining ~120DCEs. Galactic Column Density NH=1020atoms/cm2.
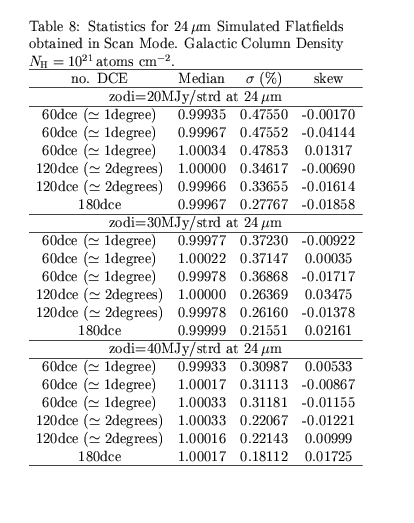
The following tables (Table 7 and Table8) give the statistics of the simulated flatfields in scan mode at 24microns as a function of number of DCEs, field and zodi brightness, and Galactic column density, where sigma is the standard deviation (in %) over the array, and skew is the skewness of the distribution of DN/s. Table 7 is for Galactic Column Density of NH=1020atoms/cm2 and Table 8 is for NH=1021atoms/cm2.
Results at 70micron
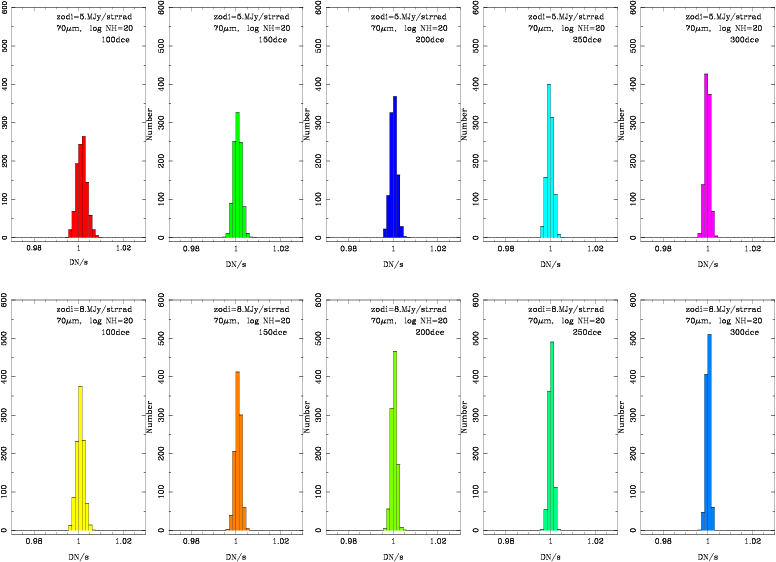
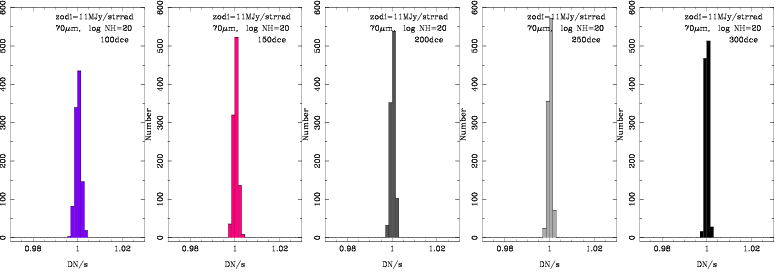
Figure 8: Simulated 70micron Ics obtained in SCAN mode. We show the effect of the zodi brightness (top panel=5.3MJy/sr, mid panel=8MJy/sr, bottom panel=10.6MJy/sr) and number of DCEs. A typical IOC flatfield observed in scan mode will be the result of median combining ~120DCEs. Galactic Column Density NH=1020atoms/cm2.
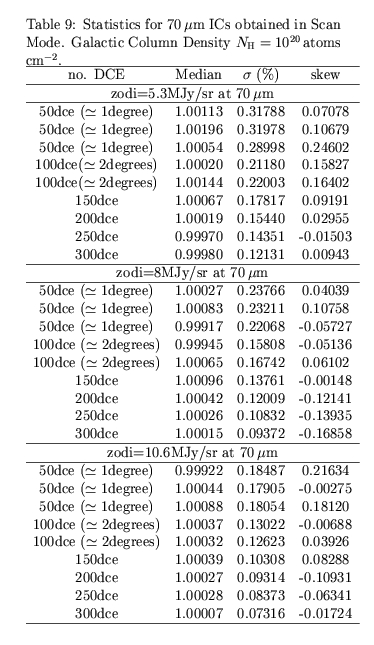
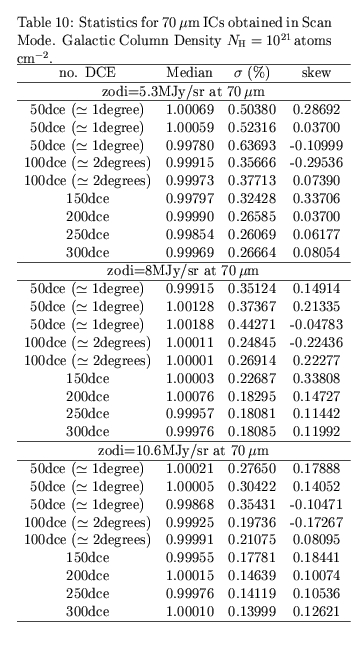
The following tables (Table 9 and Table 10) give the statistics of the simulated ICs in scan mode at 70microns as a function of number of DCEs, field and zodi brightness, and Galactic column density where sigma is the standard deviation (in %) over the array, and skew is the skewness of the distribution of DN/s. Table 9 is for Galactic Column Density of NH=1020atoms/cm2 and Table 10 is for NH=1021atoms/cm2.
Results at 160micron
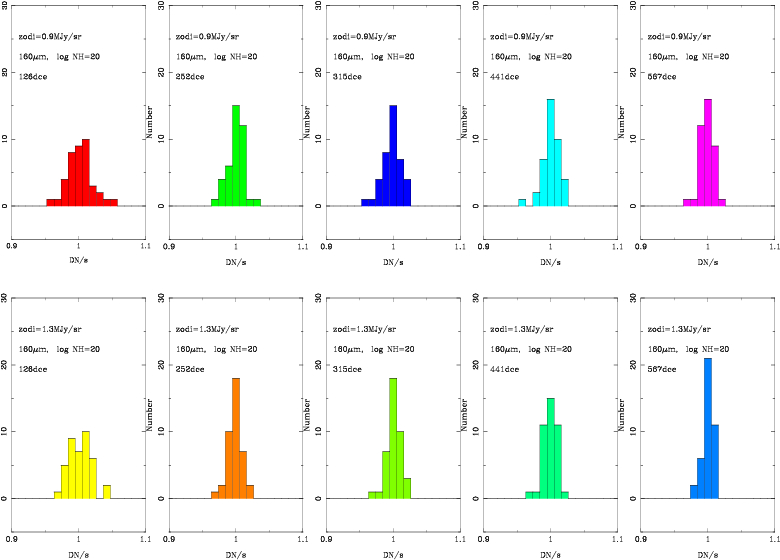
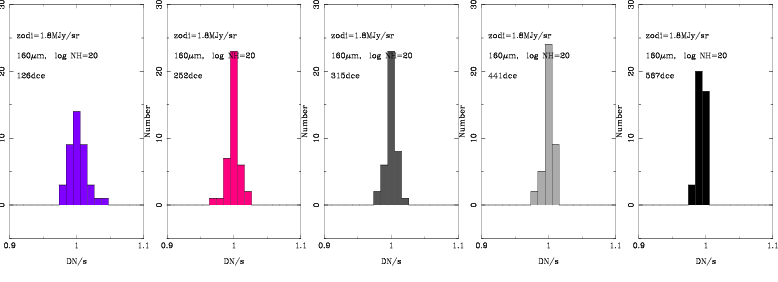
Figure 9: Simulated 160micron Ics obtained in SCAN mode. We show the effect of the zodi brightness (top panel=0.9MJy/sr, mid panel=1.3MJy/sr, bottom panel=1.8MJy/sr) and number of DCEs. A typical IOC flatfield observed in scan mode will be the result of median combining ~120DCEs. Galactic Column Density NH=1020atoms/cm2.
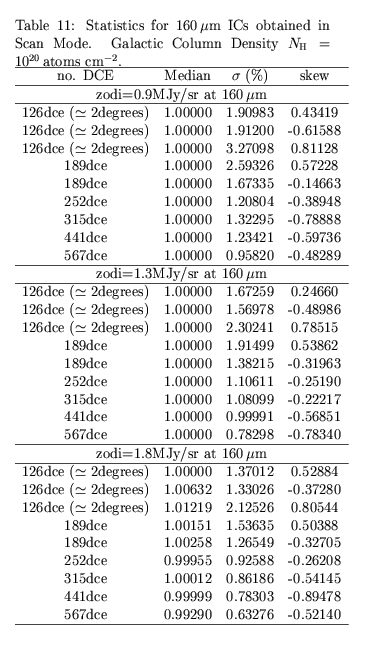
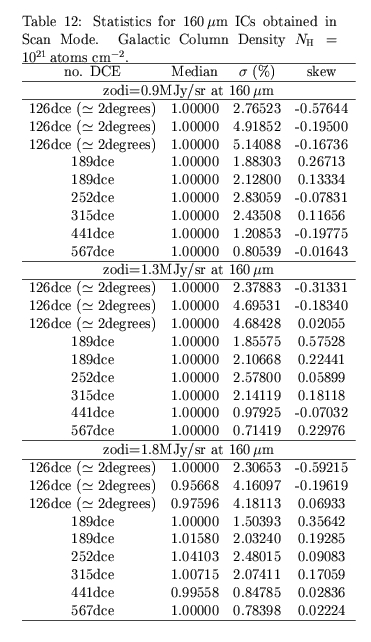
The following tables (Table 11 and Table12) gives the statistics of the simulated ICs in scan mode at 160microns as a function of number of DCEs, field and zodi brightness, and Galactic column density where sigma is the standard deviation (in %) over the array, and skew is the skewness of the distribution of DN/s. Table 11 is for Galactic Column Density of NH=1020atoms/cm2 and Table 12 is for NH=1021atoms/cm2.
Discussion and Conclusions
Dependence on observing mode (photometry vs. scan)
At 24microns we find no statistical differences in the quality of flatfields obtained in photometry mode and scan mode for a combined number of DCE > 60.
At 70 and 160microns we find that in general ICs observed in scan mode are of equal or better quality than those obtained in photometry mode. Note that in John's report he found that at 160micron ICs obtained in scan mode had lower S/N. We find however that at 160microns there is a strong dependence on the cirrus component (see below), so a direct comparison between Ics obtained in photometry and scan mode is difficult because, according to the simulations, the cirrus structure changes on scales similar to the fields covered by the observations.
Dependence on the number of combined DCEs
We find that our results on the statistical quality of simulated Ics (70 and 160microns) in terms of the number of combined DCEs are different from those in John Stansberry's report because Herve Dole's previous simulations of the sky overestimated the number of sources at all theree wavelengths.
at 24microns 60DCEs or more DCEs (depending on zodi brightness) will produce flatfields to better than 0.5%RMS for zodi brightness of 20, 30 and 40MJy/strd, and Galactic column densities of NH=1020atoms/cm2 and NH=1021atoms/cm2.
at 70micron between 100DCEs and 200DCEs (depending on zodi brightness and Galactic column density) will produce Ics to better than 0.5%
the most complicated situation appears to be at 160microns, where we find that the number of DCEs required to produce an IC to better than 1% varies between 300 and 500DCEs depending on the zodi brightness and especially the cirrus component.
Dependence on the zodi brightness
Effect of zodi brightness at 24micron. We have simulated flatfields for zodi brightness at 24micron of 20, 30 and 40MJy/strd for column densities of log NH=20 and log NH=21. For the case of lowest zodi brightness at 24microns we find that 60DCEs -that is, number of DCEs observed every time a flatfield in photometry mode is obtained - will always produce a flatfield with RMS of 0.5%. Flatfields observed at higher zodi brightnesses will always produce RMS better than 0.5%. In scan mode we will observe ~118DCE which results in RMS of between 0.3% and 0.2% depending of the 24micron zodi brightness.
Dependence on the Galactic column density (cirrus component)
The effect of the cirrus component is most significant at 70 and 160microns, so extra care will be necessary when median combining DCEs. It may be required to throw away DCEs with a bright cirrus component when constructing Ics as they can significantly degrade the quality of the IC. A clear example can be seen from Tables 5 and 6. Clearly Field 4 corresponds to an area of the sky with a higher cirrus component. When that region is used to produce an IC with 432DCEs the standard deviation becomes worse than the IC constructed with 324DCEs.
6. TO DO LIST:
Construct flatfields and ICs using mips_enhancer when this option becomes available -as during IOC this will be the automated way to make flatfields- and compare statistical quality with those made using IRAF