 If you have the SIRTF version of IDP3, click
here to view the Radial Profile documentation that corresponds to that version.
 If you have the SIRTF version of IDP3, click
here to view the Radial Profile documentation that corresponds to that version.

There's a lot of information on this page, so main idea of each section is high-lighted in red.
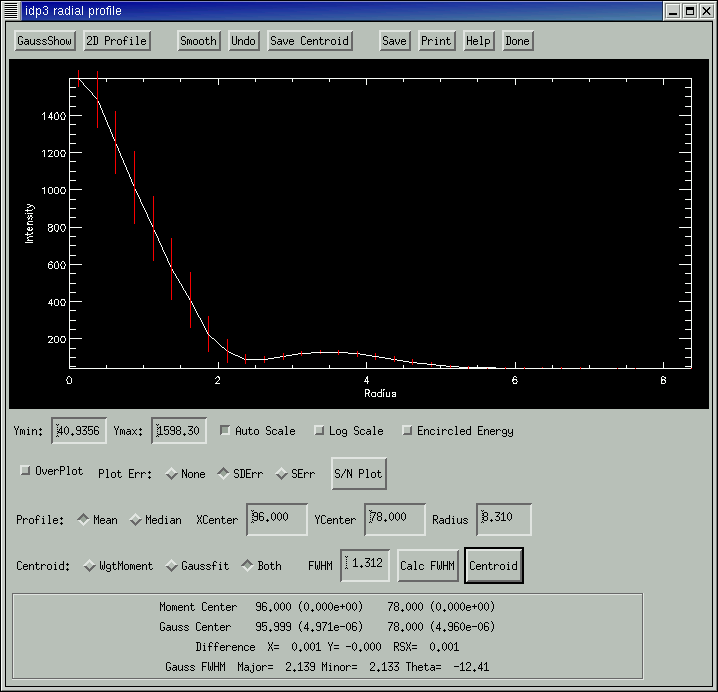
To get a radial profile, click on the button to the left of the words Radial Profile in the ROI Window. Click in the center of a star in the ROI window and drag out, creating a circle that surrounds the star. A Radial Profile Widget will now appear.
The profile may be adjusted by changing the x and y centers or radius in the appropriate boxes at the bottom of the widget. The initial guess of the centroid center is defined in the same boxes while the full width half maximum may be computed from the radial profile (Calc FWHM button) or typed in the appropriate box.
When the radial profile is calculated, it uses the zoomed data from the ROI Window, not the original showed on the Main Display Window. This is required in order to refine the center location. The user may choose between the mean and the median when computing the radial profile.
The user must enter a value for FWHM or calculate the value based on the profile data before centroiding.
Two methods are defined for computing the centroid: the weighted moment algorithm that has always been available and the 2D Gaussian fitting routine. Either or both may be selected, with the weighted moment routine the default. When both are selected the results of both fits are printed in a box on the right side of the widget with their errors and the differences between the fits in x and y and the total error. The radial profile generated from the weighted mean center is plotted as a solid line and the profile generated from the gaussian center is overlaid as a dashed line.
If a 2-d gaussian is fit the user may display the data that was fitted, the model of the fit, the residuals, and a contour map of the residuals with the gaussshow button.
The user may select the minimum and maximum values for the plot y axis to expand the y scaling. If auto scale is turned off all future plots will use the same scaling. Otherwise, the scaling is only valid for the current plot.
The user may select log scale or the default linear scale for the y-axis.
If over plot is selected subsequent radial profile plots are overplotted on the current display with no erase. Since there are six unique line styles it is not recommended to overplot more than five profiles.
The user may select to plot the associated errors over the radial profile using SDErr (standard deviations)and SErr (standard errors of the mean = SDErr/Sqrt(n)).
The S/N Plot button produces a signal to noise plot of the profile. The user must first select the error using the SErr or SDErr. The error is calculated as the radial profile is computed.
The user may select to plot the encircled energy profile instead of the radial profile.
The user can save the following fields using the SAVE button: radius, average value, encircled energy, number of points used, and number of points masked.
The user may save the radial profile as a postscript file, encapsulated postscript, PICT, TIFF, or JPEG using the PRINT button.
The user can also Save Centroids for all the "on" images.