There is a problem w/ your write-up. Check that you have valied entries for \$CAID and \$Campn in your analysis.php file. If that checks out, then Contact Stansberry"; return ; } // get first matching task $row = mysql_fetch_array($result); $title = $row["title"]; $princ = $row["principal"]; $deputy= $row["deputy"]; $campn0 = $row["campn0"]; $aorkeys = $row["aorkeys"]; // get real name of principal, deputies $princ = ioc_get_person($princ); $princ = $princ[0]; $deps = explode(",",$deputy); foreach ($deps as $depty) { $depty = trim($depty); $depty = ioc_get_person($depty); $depty = $depty[0]; $depty = explode(",",$depty); $depty = $depty[0]; // last names only $deplist[] = $depty; } $deplist = implode(", ", $deplist); $caid = sprintf("%03d",$caid); $file = "mips-".$caid.$campn.".analysis.php"; // if more matches, append the AORKEYS from those $numrows = mysql_num_rows($result); if ($numrows > 1) { $aorkeys = " " . $numrows . " Task Executions:  ". $aorkeys; for ($i=0;$i < mysql_num_rows($result); $i++) { $row = mysql_fetch_array($result); $morekeys = $row["aorkeys"]; $aorkeys = $aorkeys .';  '.$morekeys; } } // END PHP. ?> <? echo "MIPS-$caid, Campaign $campn IOC/SV Analysis"; ?>

Principal:
Deputy:
Analyst:
AORKEYS:
Last Updated:


Task Outcome Summary


Abstract

This task is designed to measure the image quality and offset from nominal focus for the MIPS 24 micron channel. The data obtained were excellent, with the exception of the left-right frame flip anomaly and the rotated world coordinates in the image headers. The focus check in campaign D2 was designed to exercise the flat fielding and PSF analysis methods needed to produce quantitative estimates during campaign E, which followed 36 hours later. The goal of rehersing for campaign E was achieved, although no speficic quantification was obtained for MIPS focus. Measurements of the image core FWHM showed that the 24 micron channel was within +/- 50 microns of optimum focus.

Analysis

The data processed through the DAT without incident. The first 24 micron flight flats proved to be excellent, and did not limit the PSF analysis as had been feared. All images were flipped left-right after output from the dat, to correct for the frame flip anomaly. IDP3 was not able to automatically align and centroid the images because the world coordinates in the fits headers were wrong. As a stopgap measure, the JPL spica package was used to automatically find the centroids of the largest bright object in the field above a specified isophote. The images were then shifted and medianed on a 4x oversampled grid, yielding reconstructed PSFs at high signal/noise. Of the two focus stars, we chose to work with the data on K star HD 53501 because its flux density (1.2 Jy) was well below the pre-launch 3 sec saturation limit of 1.9 Jy. The other star (G star HD 2151) had a 2 Jy flux density, which was probably OK, but we avoided using it just to be safe. Model PSFs for a range of defocus positions were produced with the SIRTF Tiny TIM software version 1.3. These models were calculated for the field center.

Results

The FWHM of the PSF core was determined by Gaussian fitting to be near 2.2 x 2.1 pixels, consistent with pre-launch expectations when distortion is factored in.


Figure 1: MIPS 24 micron images of (left) K star HD 53501; (center) in-focus STinyTIM simulation; and (right) G star HD 2151. All are displayed in a log scale.

In the above image, the remarkable similarity between the Tiny TIM simulation (center) and the two reconstructed star images is clear. Background objects with brightnesses near 1 mJy appear near the two focus stars; the fact that number and location of these objects is different between the two targets makes clear that none of these point sources is a ghost or an intrinsic feature of the PSF.


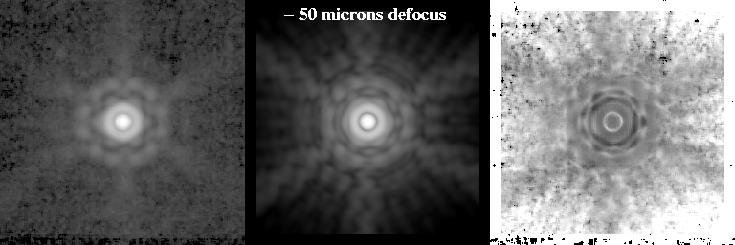
Figure 2: MIPS 24 micron images of (left) K star HD 53501; (center) defocused STinyTIM simulation; and (right) the sky/model ratio. All are displayed in a log scale.


Figure 3: MIPS 24 micron images of (left) K star HD 53501; (center) defocused STinyTIM simulation; and (right) the sky/model ratio. All are displayed in a log scale.


Figure 4: MIPS 24 micron images of (left) K star HD 53501; (center) defocused STinyTIM simulation; and (right) the sky/model ratio. All are displayed in a log scale.


Figure 5: MIPS 24 micron images of (left) K star HD 53501; (center) defocused STinyTIM simulation; and (right) the sky/model ratio. All are displayed in a log scale.


Figure 6: MIPS 24 micron images of (left) K star HD 53501; (center) defocused STinyTIM simulation; and (right) the sky/model ratio. All are displayed in a log scale.


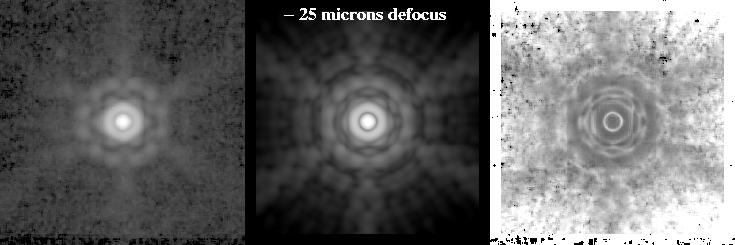
Figure 7: MIPS 24 micron images of (left) K star HD 53501; (center) defocused STinyTIM simulation; and (right) the sky/model ratio. All are displayed in a log scale.


Figure 8: MIPS 24 micron images of (left) K star HD 53501; (center) defocused STinyTIM simulation; and (right) the sky/model ratio. All are displayed in a log scale.


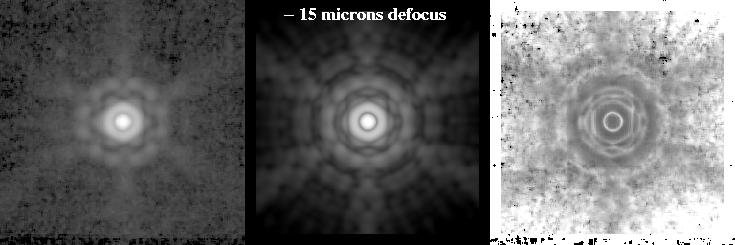
Figure 9: MIPS 24 micron images of (left) K star HD 53501; (center) defocused STinyTIM simulation; and (right) the sky/model ratio. All are displayed in a log scale.


Figure 10: MIPS 24 micron images of (left) K star HD 53501; (center) defocused STinyTIM simulation; and (right) the sky/model ratio. All are displayed in a log scale.


Figure 11: MIPS 24 micron images of (left) K star HD 53501; (center) defocused STinyTIM simulation; and (right) the sky/model ratio. All are displayed in a log scale.


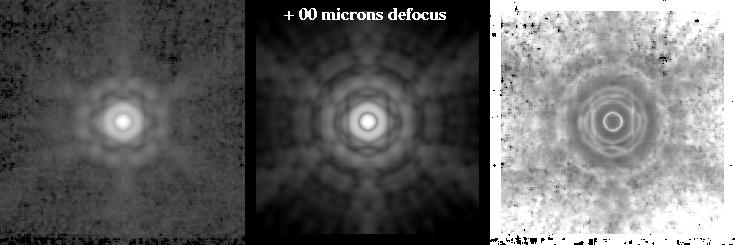
Figure 12: MIPS 24 micron images of (left) K star HD 53501; (center) defocused STinyTIM simulation; and (right) the sky/model ratio. All are displayed in a log scale.


Figure 13: MIPS 24 micron images of (left) K star HD 53501; (center) defocused STinyTIM simulation; and (right) the sky/model ratio. All are displayed in a log scale.


Figure 14: MIPS 24 micron images of (left) K star HD 53501; (center) defocused STinyTIM simulation; and (right) the sky/model ratio. All are displayed in a log scale.


Figure 15: MIPS 24 micron images of (left) K star HD 53501; (center) defocused STinyTIM simulation; and (right) the sky/model ratio. All are displayed in a log scale.


Figure 16: MIPS 24 micron images of (left) K star HD 53501; (center) defocused STinyTIM simulation; and (right) the sky/model ratio. All are displayed in a log scale.


Figure 17: MIPS 24 micron images of (left) K star HD 53501; (center) defocused STinyTIM simulation; and (right) the sky/model ratio. All are displayed in a log scale.


Figure 18: MIPS 24 micron images of (left) K star HD 53501; (center) defocused STinyTIM simulation; and (right) the sky/model ratio. All are displayed in a log scale.


Figure 19: MIPS 24 micron images of (left) K star HD 53501; (center) defocused STinyTIM simulation; and (right) the sky/model ratio. All are displayed in a log scale.


Figure 20: MIPS 24 micron images of (left) K star HD 53501; (center) defocused STinyTIM simulation; and (right) the sky/model ratio. All are displayed in a log scale.


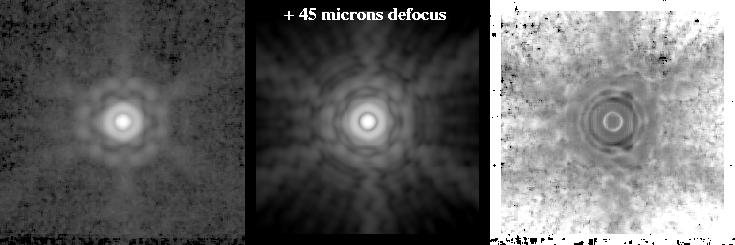
Figure 21: MIPS 24 micron images of (left) K star HD 53501; (center) defocused STinyTIM simulation; and (right) the sky/model ratio. All are displayed in a log scale.


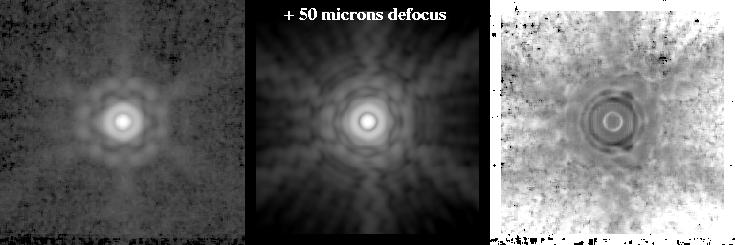
Figure 22: MIPS 24 micron images of (left) K star HD 53501; (center) defocused STinyTIM simulation; and (right) the sky/model ratio. All are displayed in a log scale.

In the 21 images above, one sees how MIPS PSF is expected to change as a function of focus position. Of particular importance are the six lobes in the inside edge of the second dark Airy ring. The lobes are separate and distinct in the in-focus model, and in the MIPS 24 sky images. At large defocus values (say, greater than 30 microns from best focus), these six lobes begin to blend together; this is not seen in the sky images. We therefore concluded that the MIPS 24 micron channel was certainly within +/- 40 microns of best focus. This result made clear that we did not need to consider consider a broader range of defocused PSF models (+/- 50 microns) than we had used in focus rehersals.

Conclusions

The sky background was sufficiently low that we could see the PSF wings clearly, and have confidence that the CTA would be ready for full focus determination in Campaign E. The 24 micron images flattened extremely well. MIPS 24 is less than 40 microns from best focus.

Output and Deliverable Products

The major deliverable was in the form of experience preparing the team for campaign E. The final MIPS flight focus report, including results from campaign D2, can be found
here.

Actions Following Analysis