Results
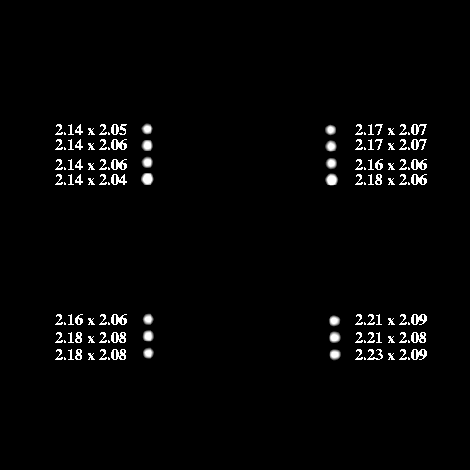
Figure 1: Coaddition of 30 separate
dither frames from the first cluster target position, for K star HD 53501.
The PSF FWHM values are given in pixel units, and were measured by Gaussian fitting
in IDP3 using an aperture of 6 pixels radius. The numbers give the FWHM along
the X and Y axes of the detector array, respectively.
In the above figure, one can see how the apparent size of the MIPS 24 image
core varies with dither position in the standard small-field photometry AOT. The
larger image size the in X direction is fully consistent with pre-launch expectations
for different plate scales in the X and Y directions: 2.4932 arcsec/pixel in X, and 2.5981
arcsec/pixel in Y from ray tracing (J. Keene, personal communication). The variation
of the FHWM with field position is due to higher order distortion terms.
We now show five radial profile plots comparing the observed 24 micron PSF with SIRTF
Tiny TIM models. In these plots, the sky data is represented by three solid lines.
The central line is the median radial profile, and the upper and lower solid lines
represent "error bars" to the median profile. The errors are calculated for +1 and -1
sigma changes in the sky background level, and do not include systematic effects.
The dashed lines are the family of curves for model PSFs at negative focus positions,
and the dotted lines are the same but for positive focus positions. The two vertical
bold lines define the inner and outer boundaries of the second dark Airy ring, and
thus bound the region of interest for the data/model comparison. If the SIRTF
Tiny Tim models were exactly correct, if there were no systematic normalization
or alignment errors in the radial profiles, and if MIPS was in perfect focus, then
the median radial profile would appear as a flat horizontal line at radial profile
ratio value = 1.
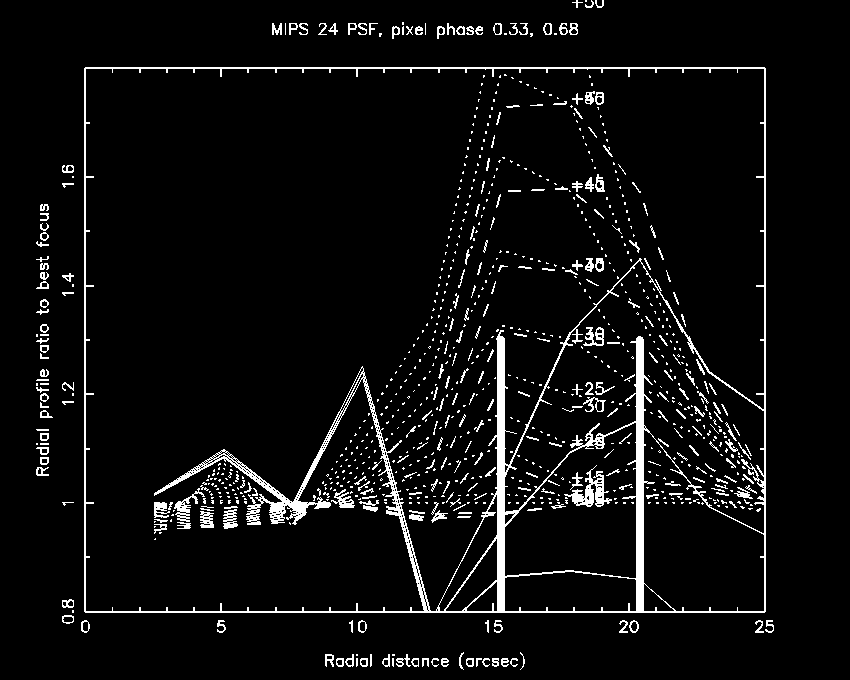
Radial profile of MIPS 24 micron PSF using the coaddition of two 3 second
exposures taken at pixel position 38.3, 84.7.
The above result isn't very good - the median observed profile doesn't stay
within the family of defocus curves; the upper error bar profile actually
crosses all the model defocus values !
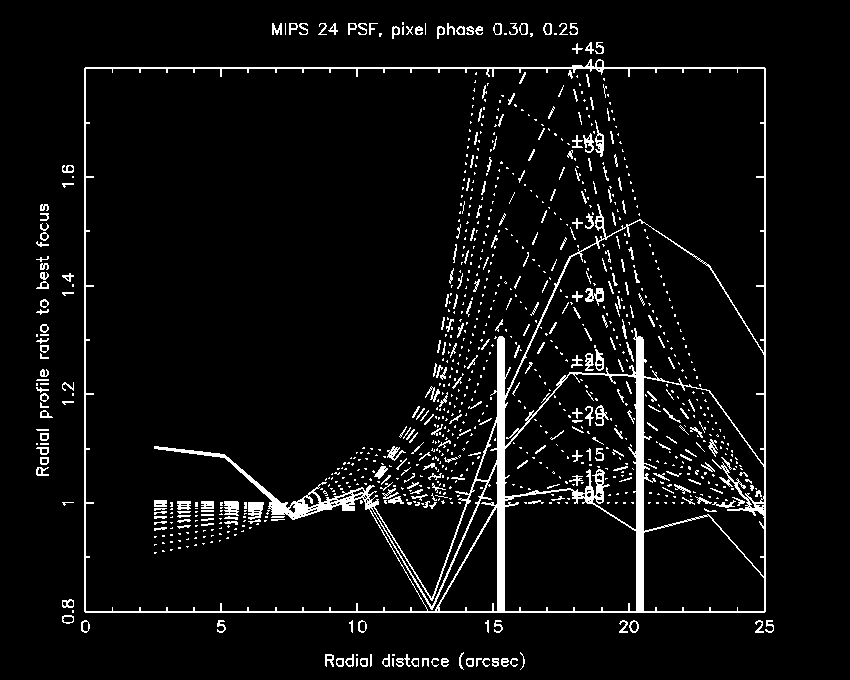
Radial profile of MIPS 24 micron PSF using the coaddition of two 3 second
exposures taken at pixel position 38.3, 89.3.
This result is usable - the median radial profile travels near the -20 curve.
But the error bars allow a huge range of models.
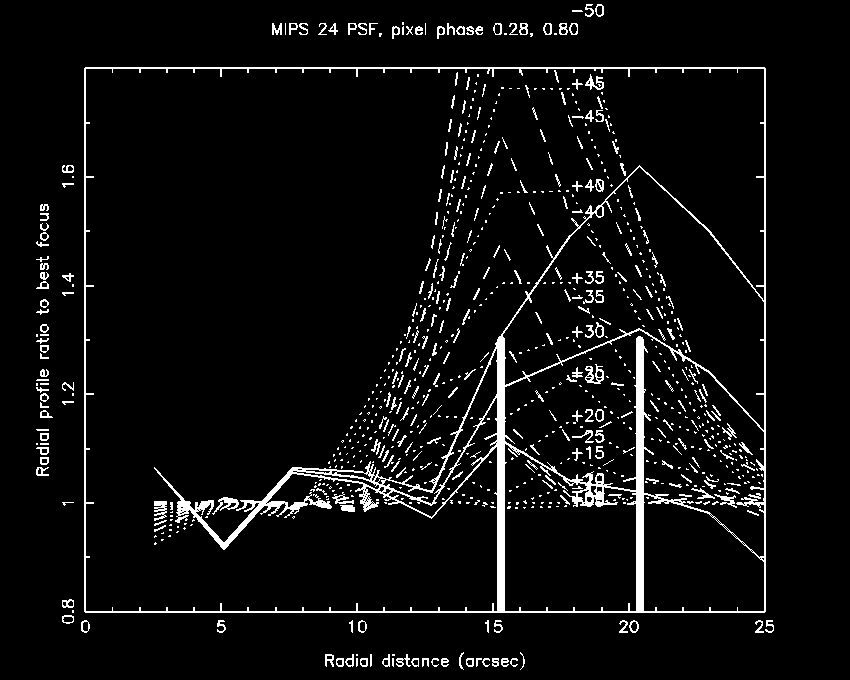
Radial profile of MIPS 24 micron PSF using the coaddition of two 3 second
exposures taken at pixel position 38.3, 93.8.
This reslt is usable - the median radial profile travels near the +25 to +30
curves. But the error bars allow a huge range of models.
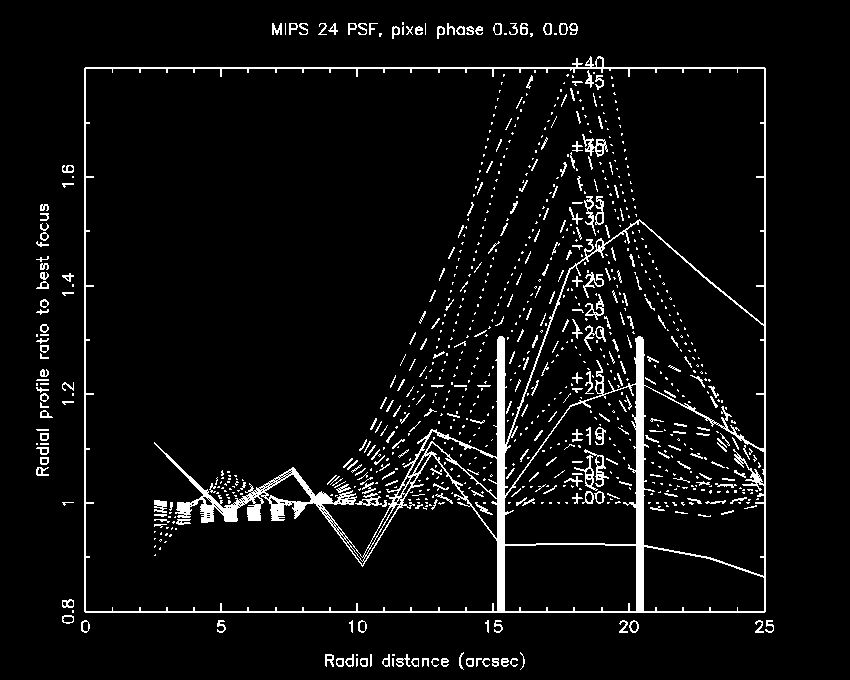
Radial profile of MIPS 24 micron PSF using the coaddition of two 3 second
exposures taken at pixel position 38.4, 80.1.
This result is usable - the median radial provile travels near the -20 curve.
But the error bars allow a huge range of models.
With the four plots above showing large errors, we spent a good deal of
effort to investigate how to get better agreement between the data and the
models. The background measurements and centroid determinations were re-checked.
We investigated whether an error in the assumed plate scale might lead to
errors in the radial profile comparison; the SIRTF Tiny Tim models assume
square pixels, whereas both raytracing and IOC measurements show a small
scale difference between the X and Y axes. It was found that changing the
plate scale of the Tiny Tim models by 1% did not substrantially change the
quality of the radial profile fits. We also investigated whether the 24 micron
bandpass in Tiny Tim was correct; eventually we verified that it was,
although not until we had mistakenly believed for a few days that it wasn't.
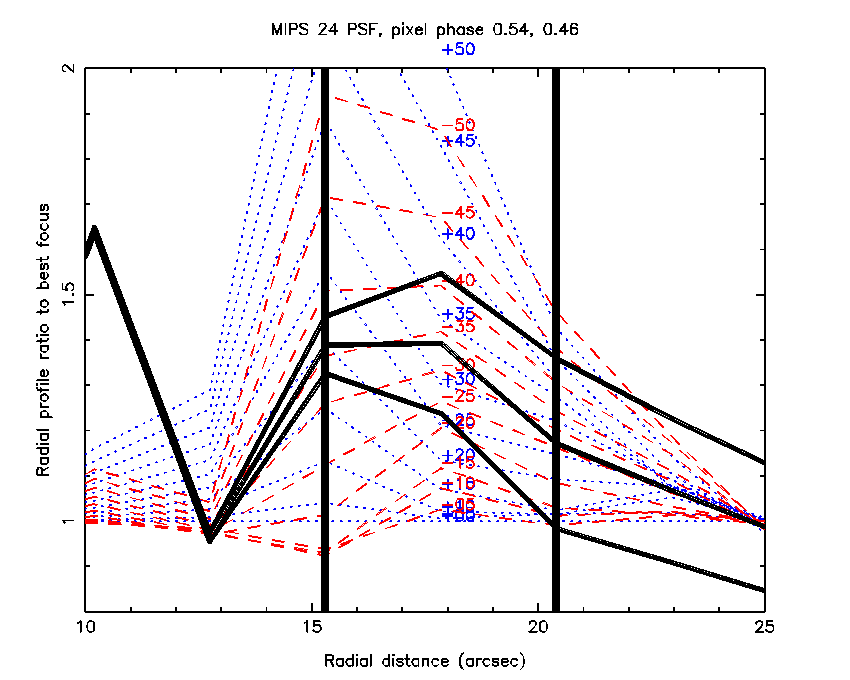
Radial profile of the MIPS 24 micron PSF using the coaddition of
thirty-two 3 second exposure taken at various positions over the
upper left quandrant of the array.
This is the best result, largely because coadding the 16 dither positions has
give much better S/N on the background, and as a result, the random error bars
are much closer together. Based on what model defocus values the median curve
crosses, the formal focus determination is +20 to +33 or -26 to -36. An error
bar of +/- 15 microns still applies to each of these ranges, It seems clear
that MIPS is not at zero defocus.


