// ENTER CAID, CAMPN, and Analyst WITHIN THE QUOTES IN THE FOLLOWING 2 LINES ... $caid="160"; // e.g. $caid = "90"; $campn="Q"; // e.g. $campn = "D2" or $campn = "Q" or $campn="meta"; $analyst="J. Stansberry, K. Misselt"; // e.g. $analyst="D. Kelly"; // YOU CAN SKIP DOWN TO THE OUTCOME SECTION NOW. include ("IOC_connect.php"); // this line isn't for you include ("IOC_log_fns.php"); // this line isn't for you $db = ioc_db_connect(); $query="select * from ioc_tasks where camp_crnt = '$campn' and caid = $caid "; $result = mysql_query($query); if (mysql_num_rows($result) < 1) { echo "
Principal:
Deputy:
Analyst:
AORKEYS: if (! $aorkeys) {echo "unknown";} else { echo $aorkeys;}?>
Last Updated: if (file_exists($file)) {echo date("D M d Y, H:i:s", filemtime($file) ) ;} ?>
Signal vs. DCE number for the good half of the 70 µm array is shown below for one 6-exposure data cycle, and for the entire 6.1 hour experiment. The CVZ dark pointing was used, so the signal on sky is only slightly higher than the signal when the scan mirror was placed in the dark position. There is very little difference between the dark level in the 70 µm dark A and 160 µm dark positions, the latter of which is roughly equivalent to SED mode for the 70 µm array. Significant hook is seen in the stim flashes; this transient is probably caused by the sudden change in illumination level when going from dark to sky.
Figure 1. Signal vs. time averaged over the good half of the 70 µm array (top panel) and for 4 pixels on that half (lower 4 panels) during the first 6-exposure data taking cycle. Vertical dotted lines denote breaks between exposures. The sequence of exposure types is noted above. Postscript version of this plot.
Figure 2. Signal vs. time averaged over the good half of the 70 µm array (top panel) and for 4 pixels on that half (lower 4 panels) over the entire 6.1 hour experiment. Postscript version of this plot.
Signal vs. DCE number for the 160 µm array is shown below for one 6-exposure data cycle, and for the entire 6.1 hour experiment. As seen at 70 µm, there is very little difference between the dark level in the 70 µm dark A and 160 µm dark positions. Unlike the 70 µm array, the 160 does not display significant hook (a tiny bit of hook is visible for the first few DCEs of the first sky+stim exposure); this is consistent with the behavior seen in ground test.
Figure 3. Signal vs. time averaged over the good half of the 70 µm array (top panel) and for 4 pixels on that half (lower 4 panels) during the first 6-exposure data taking cycle. Vertical dotted lines denote breaks between exposures. The sequence of exposure types is noted above. Postscript version of this plot.
Figure 4. Signal vs. time averaged over the good half of the 70 µm array (top panel) and for 4 pixels on that half (lower 4 panels) over the entire 6.1 hour experiment. Postscript version of this plot.
"Readnoise" and dark current as a function of time after the anneal is summarized below. Here readnoise is the effective DCE-to-DCE scatter in the computed slope, and includes all noise after the removal of the photon-noise component. A table and brief description of the analysis are available here.
Figure 5. Dark current on the 70 and 160 µm arrays vs. time since the anneal at the beginning of the experiment. All data collected at either dark position was analyzed and is shown above: there is no obvious dependence of dark level for either array on whether it was in its primary dark position, or in the dark position for the other array. Postscript version of this plot.
Figure 6. Readnoise on the 70 and 160 µm arrays vs. time since the anneal at the beginning of the experiment. All data collected at either dark position was analyzed and is shown above. Note that the readnoise on side B of the 70 µm array is plotted 5 times below its actual value. Postscript version of this plot.
Stim Repeatability: 70 µm
Repeatability of measured stim-flash brightness was determined on a pixel-by-pixel basis. The repeatability during this task is compared with repeatability from several other campaigns in the figure below. The anneal in campaign Q provided significantly better stim repeatability than had been seen in earlier campaigns during the first 2 hours after an anneal, with the caveat that in campaigns before Q we were not really annealing, or were barely annealing, the arrays due to an improperly set anneal current in the irs-mips patch block.
Figure 7. Repeatability of measured stim flash amplitude, given as array-averaged standard deviation. Symbols correspond to campaigns: circle = camp. O; square= camp. J; diamond = camp. K; triangle = camp. P, star = camp. Q task mips-160. Colors indicate wether the anneal was an instrument start-up anneal (green), or a mid-campaign anneal (blue). Campaign Q data is further called out by being colored red. Postscript version of this plot.
Stim Repeatability: 160 µm
Conclusions
The anneal introduced a fairly significant change in resposivity on both arrays. The time constant for the transient to disappear was about 3 hours on the 160 µm array, and longer than 6 hours on the 70 µm array.
Dark current and readnoise did not increase as a result of the annea, and both were roughly equivalent to values from earlier campaigns. An exception to that is the dark on side B of the 70 µm array, which may have been significantly reduced by the anneal.
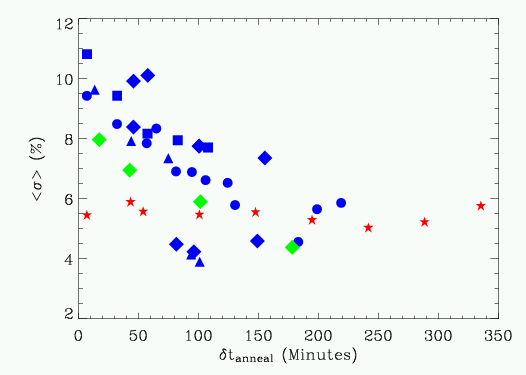
Stim repeatability was improved by annealing, in particular during the first 2 hours after the anneal.
Photometric stability, repeatability, and linearity were not determined in this test. If this task is repeated, making photometric measurements should be a priority.
Output and Deliverable Products
None.Actions Following Analysis