Principal:
Deputy:
Analyst:
AORKEYS:
Last Updated:
|
Observed IRAS Sources for Saturation |
||||||
| IRAS |
flux 60 |
factor |
flux 100 |
factor |
visibility |
comment |
| |
(Jy) | [*] |
(Jy) | [*] |
|
|
| 18212+7432 | 10.3 | 3.1 | 31.78 | 4.5 | CVZ | v bright cold [source 1] |
| 16577+5900 | 7.43 | 2.3 | 23.58 | 3.3 | CVZ | v bright cold [source 2] |
| 16418+6540 | 3.45 | 1.1 | 7.37 | 1.6 | CVZ | bright cold [source 3] |
| F17069+6047 | 3.01 | 0.9 | 4.99 | 0.7 | CVZ | bright (less) cold [source 4] |
| F16460+5910 | 1.4 | 0.42 | 3.2 | 0.45 | CVZ | faint cold [source 5] |
| 17403+6234 | 2.08 | 0.6 | 1.03 | 0.15 | CVZ | faint warm [source 6] |
|
Read Number of Saturation, Observation of IRAS Sources |
||||||||
| IRAS |
flux 60 |
flux 100 |
Saturation 70 |
Saturation 160 |
||||
| |
(Jy) | (Jy) |
3s DCE | 4s DCE |
10s DCE |
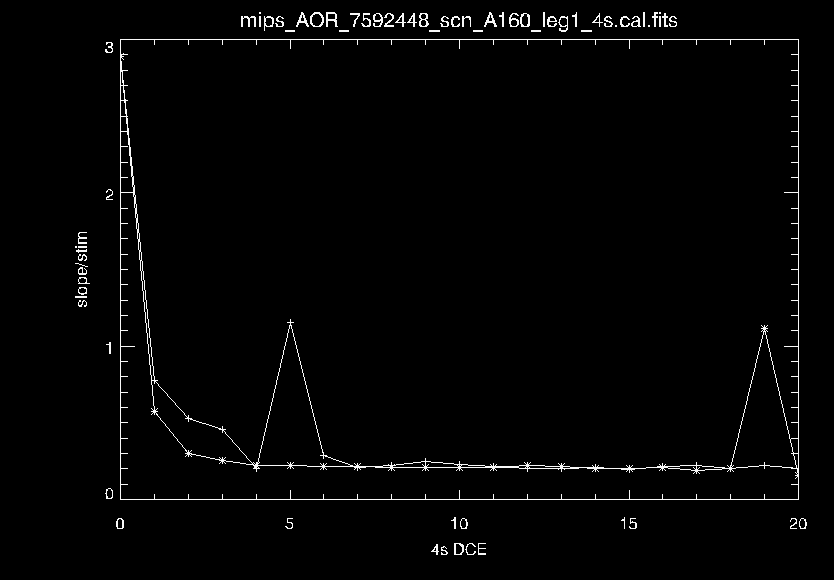
3s DCE | 4s(*) DCE |
10s DCE |
| 18212+7432 | 10.3 | 31.78 | no sat | no sat | no sat | 3 | 8 / 7 | 4 |
| 16577+5900 | 7.43 | 23.58 | no sat | no sat | no sat | 3 | 10 / 7 | 4 |
| 16418+6540 | 3.45 | 7.37 | no sat | no sat | no sat | 8 | 28 / 12 | 8 to 9 |
| F17069+6047 | 3.01 | 4.99 | no sat | no sat | no sat | 13 | no sat / 16 | 11 to 14 |
| F16460+5910 | 1.4 | 3.2 | no sat | no sat | no sat | 12 to 20 | no sat | 15 |
| 17403+6234 | 2.08 | 1.03 | no sat | no sat | no sat | no sat | no sat | 20 |