Principal:
Deputy:
Analyst:
AORKEYS:
Last Updated:
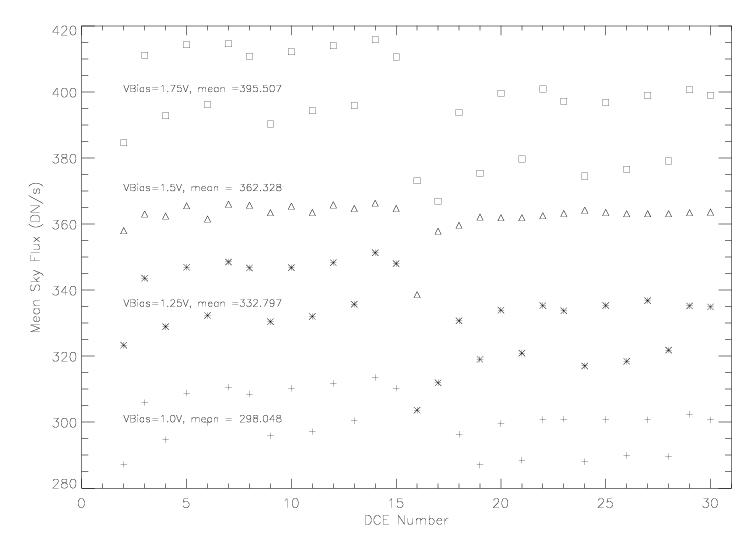
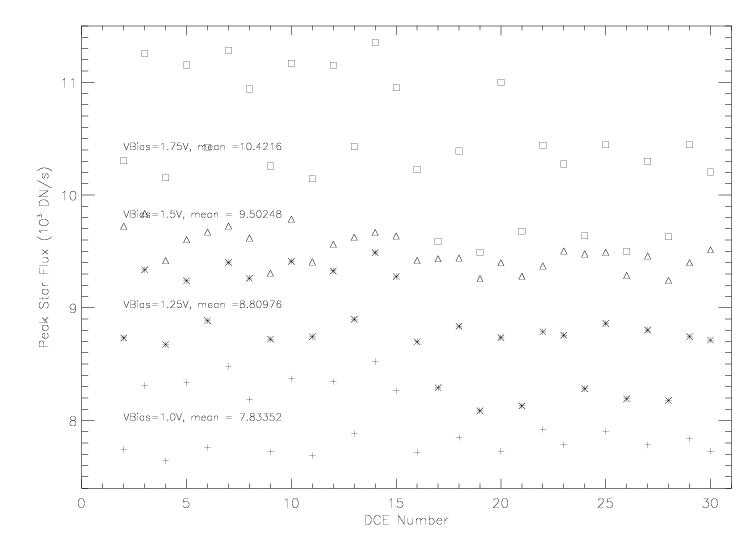
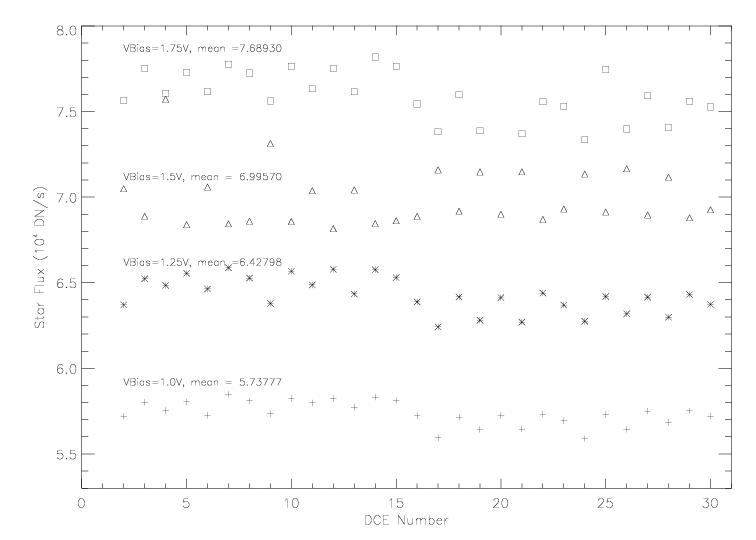
The following steps were followed in analyzing the data:
1) I used V2.41 of mips_sloper and mips_caler to reduce the data.
2) For the 35 DCE read noise data set, I ran mips_sloper with the
   flags -b -d -l   I then ran the IDL routine get_rdnoise_new with
   the flags n_dce_rej=5,max_dce=35,empir_cr=4.0.  This routine provided
   measurements of the read noise and dark current.  A median filter
   and sigma rejection algorithm are included in the read noise program
   to remove cosmic rays.
3) For the standard star observations I used the following:
   mips_sloper -w -j CamO filename
   mips_caler  -C CamO filename
4) I performed photometry on the standard star AOT data using the IRAF
   task imexamine with the following parameters:
   radius = 6, inner radius of sky annulus = 11, width of sky annulus = 5,
   center = yes, background = yes, iterations = 1
5) I plotted the total sky-subtracted star flux, the peak flux, and the
   sky flux as a function of DCE number for each bias voltage (see below).
   These plots show the well-known dependence of star flux on scan mirror
   position.  To remove this effect, I reran mips_caler with the +m flag
   to make use of scan mirror position dependent flatfields.  I also ran
   the data through mips_enhancer with the flag -dy to make distortion
   corrections.  While the source repeatability was greatly improved,
   there was still a strong pattern with scan mirror position.  This
   residual pattern appears to be caused by an inadequacy in the
   calibration data, and it is the greatest obstacle to determining the
   source repeatability at this time.  Since a lot of work is required
   to use mips_enhancer on these data, I only performed this analysis
   for one of the four data sets.  I will consider performing this
   analysis on all four data sets when better calibration data are
   available.
MIPS Campaign O results:
AORID  Bias Voltage    Dark Current(e/s)    Read Noise(e)    Avg # DCEs used
         ------  before solar storm  ------
7323136   1.5 V         12.5 +/- 4.7        37.5 +/- 8.3         29.86
         ------  during solar storm  ------
7738368   1.0 V         10.8 +/- 5.2        37.3 +/- 8.5         29.73
7738112   1.25V         13.1 +/- 6.2        50.1 +/-10.7         29.74
7737856   1.5 V         16.0 +/- 6.0        44.2 +/- 9.3         29.73
7738624   1.75V         15.8 +/- 6.2        43.4 +/- 7.9         29.74

AORID  Bias Voltage    Mean Star Flux     Mean Sky Flux    Peak Star Flux
7742208   1.0 V            57400               298              7830
7741952   1.25V            64300               333              8810
7741696   1.5 V            70000               362              9570
7742464   1.75V            76900               396             10400
Each increase in bias voltage produced roughly a 10% increase in the responsivity of the array. From the noise measurements, it appears that the dark current increased roughly 20% with each bias step. The increase in read noise is harder to judge given the high cosmic ray rate but appears to be no greater than about 8% per bias step. The overall signal-to-noise thus appears to increase slightly with bias, but the effect is fairly subtle. The source repeatability is still dominated by calibration errors. Visual inspection of the data shows no clear preference of bias voltage based on repeatability, with the repeatability expected to be better than than 1% for each of these bias voltages.
Plots of star flux, sky flux, and peak star flux vs DCE number can be found in the following plots: