Principal:
Deputy:
Analyst:
AORKEYS:
Last Updated:
The following steps were followed in analyzing the data:
1) V2.31 of mips_sloper was used to reduce the data.  We used flags -l -j CamG
   for the stim-calibrated dark data and -l -q -j CamG for the read noise
   data.  The 160um read noise data also included a -y flag, to output the
   data in 2x28 rather than 3x20 format.  The stim-calibrated darks were
   also run through mips_sloper with the flags -d -C CamG.
2) We used get_rdnoise_new.pro on the
   70um data to calculate read noise and dark current.  We set n_dce_rej=10.
   We also used the bad70 flag that Karl G added to the get_rdnoise program
   to exclude the B-side of the array and readout 4,4 on the A-side.  The
   160um data were analyzed using new routines developed by Karl G.  In his
   new version of get_rdnoise, he no longer rejects DCEs based on the cosmic
   ray flag.  Instead, he rejects 3-sigma outliers.  With the old routine,
   the noise was based on only a handful of DCEs out of 50.  With the new
   routine, the number of DCEs used is usually about 48/50.  Additional
   details are available in the writeup for metatask 2005.
3) The stim-calibrated dark data were run through the IDL program
   mips246_stimcal.pro with flag
   'skip=10' to determine the mean stim brightness and the stim repeatability.
   This program determines the array mean for each of the stim flashes,
   ignoring the first 'skip' flashes, and then determines the mean of
   these mean brightnesses.  It also takes the brightness of each
   odd-numbered flash, divides that number by the average of the adjacent
   even-numbered flashes, and then calculates the standard deviation of
   these normalized values.  This is not the best way of assessing stim
   repeatability, but it does provide a crude first estimate.  It is
   a quantitative representation of the array-average brightness plots
   presented by John S below.
4) Karl Misselt performed a stim repeatability assessment, using the
   same methodology used in his earlier report on 70um stim repeatability.
   Details and plots will follow in a later version of this writeup.
5) The stim-calibrated dark data were run through the IDL program
   mips246_darkcal.pro.  This
   program determines the array mean for each of the dark DCEs, then
   calculates the mean and standard deviation of these array means.
   It is possible to set the number of DCEs to ignore after each stim
   flash, to minimize the effect of stim latents.  In practice, since
   the cosmic ray filtering is not perfect, I used the skip parameter
   as best I could to clean out the effect of bad DCEs.  A median
   filter would have been more effective and will be implemented later,
   when there is more time to reanalyze the data.  I will also try
   using the -q flag in mips_sloper, for 3sigma rather than 5sigma
   cosmic ray filtering.  For now, the dark levels from the read noise
   data are probably a more accurate assessment of dark levels, even
   though they are not stim-calibrated.  I record the time since the
   last thermal anneal in the tables below so that an eyeball correction
   can be made for the effect of cosmic rays.  This post-anneal time
   is also useful in looking at Karl's stim repeatability results.
6) These results can be combined with insights into the effects of bias
   voltage on the dynamic range of the detector, the linearity of the
   data ramps, and the behavior of the B-side of the 70um array in
   deciding how best to set the detector bias.
AORID 70Bias 160Bias 70ReadNoise 70DarkCurrent 160ReadNoise 160DarkCurrent
(mV) (mV) (e) (e/s) (e) (e/s)
7152640 30 15 385 +/- 156 583 +/- 208 2190 +/- 940 3350 +/- 2700
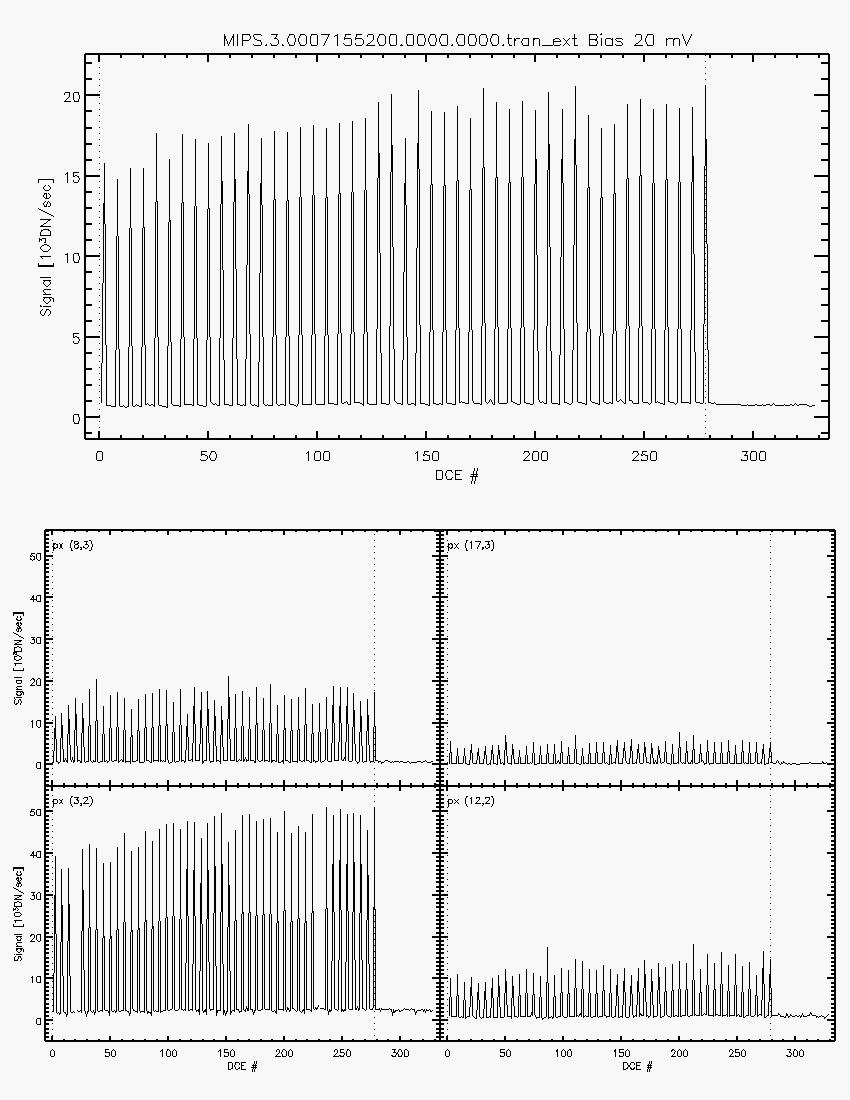
7155200 30 20 381 +/- 132 617 +/- 233 4910 +/- 3060 4900 +/- 2770
7152896 35 20 4900 +/- 2770 5420 +/- 4060
7155456 35 25 644 +/- 217 472 +/- 163 10420 +/- 6100 9320 +/- 8110
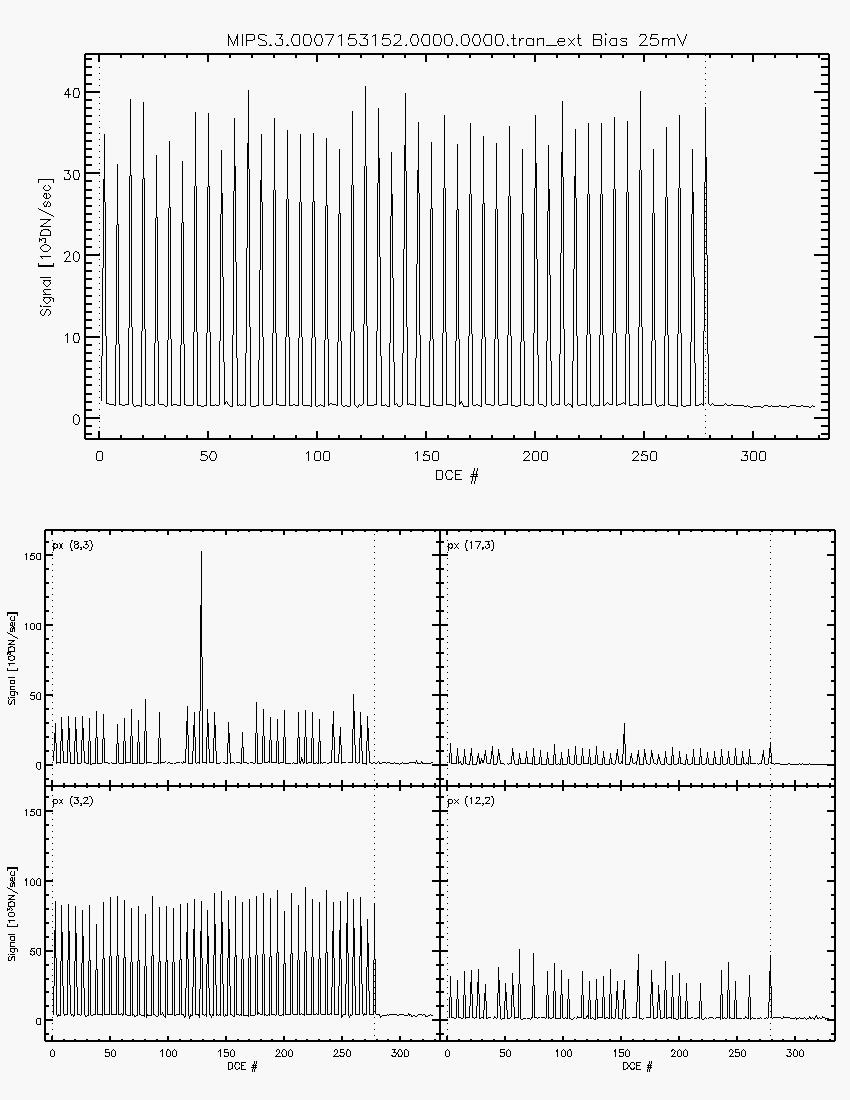
7153152 40 25 531 +/- 202 718 +/- 270 10400 +/- 7040 8920 +/- 6490
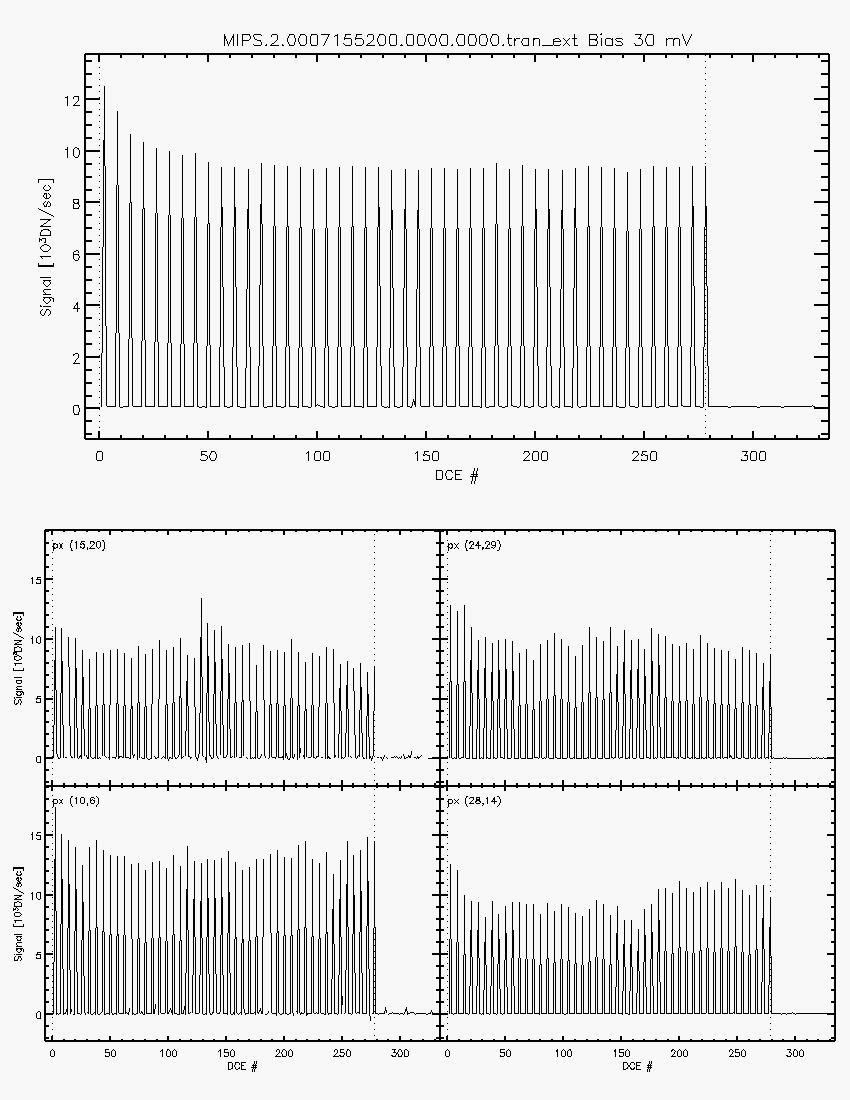
7153408 40 30 538 +/- 183 697 +/- 257 TBD TBD
7155712 40 35 721 +/- 266 654 +/- 228 59650 +/-19960 31150 +/-11430
7152384 45 35 783 +/- 293 615 +/- 210 61690 +/-18140 29730 +/- 9370
7155968 45 15 829 +/- 340 773 +/- 261 2500 +/- 1030 3480 +/- 2270
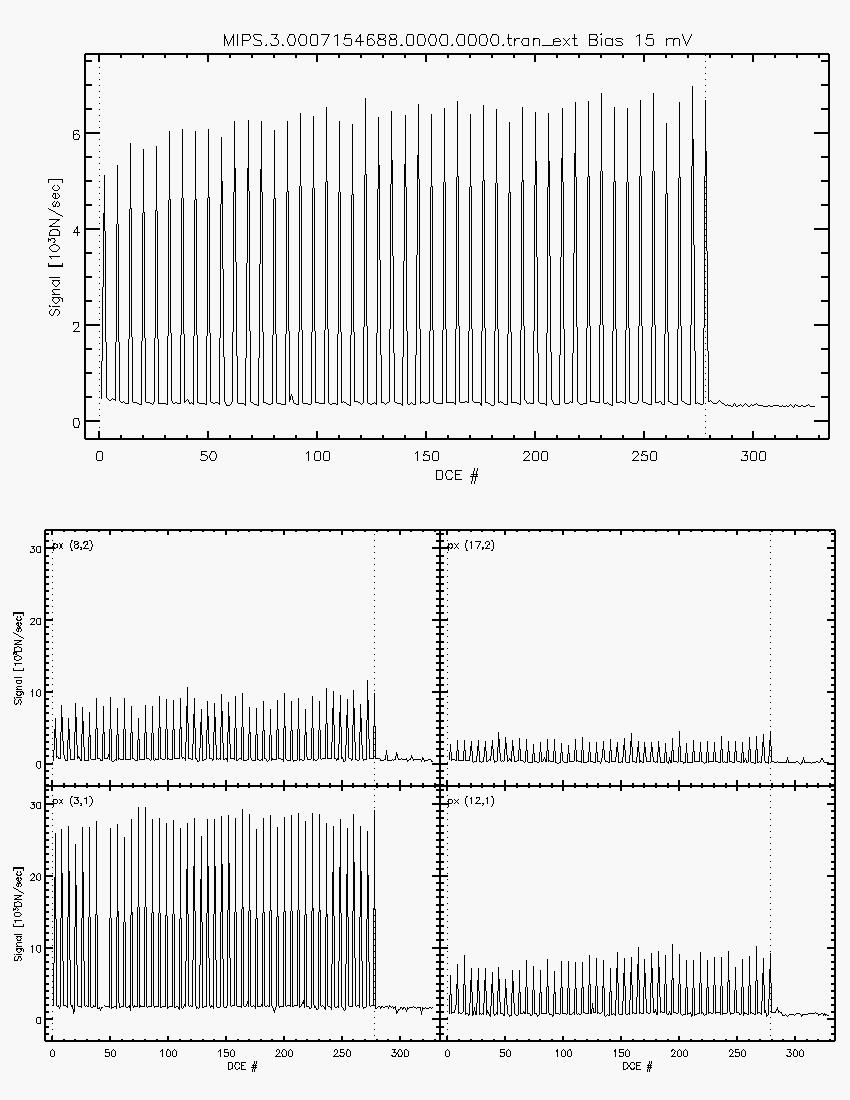
7154688 50 15 871 +/- 351 773 +/- 268 2880 +/- 1500 3750 +/- 2450
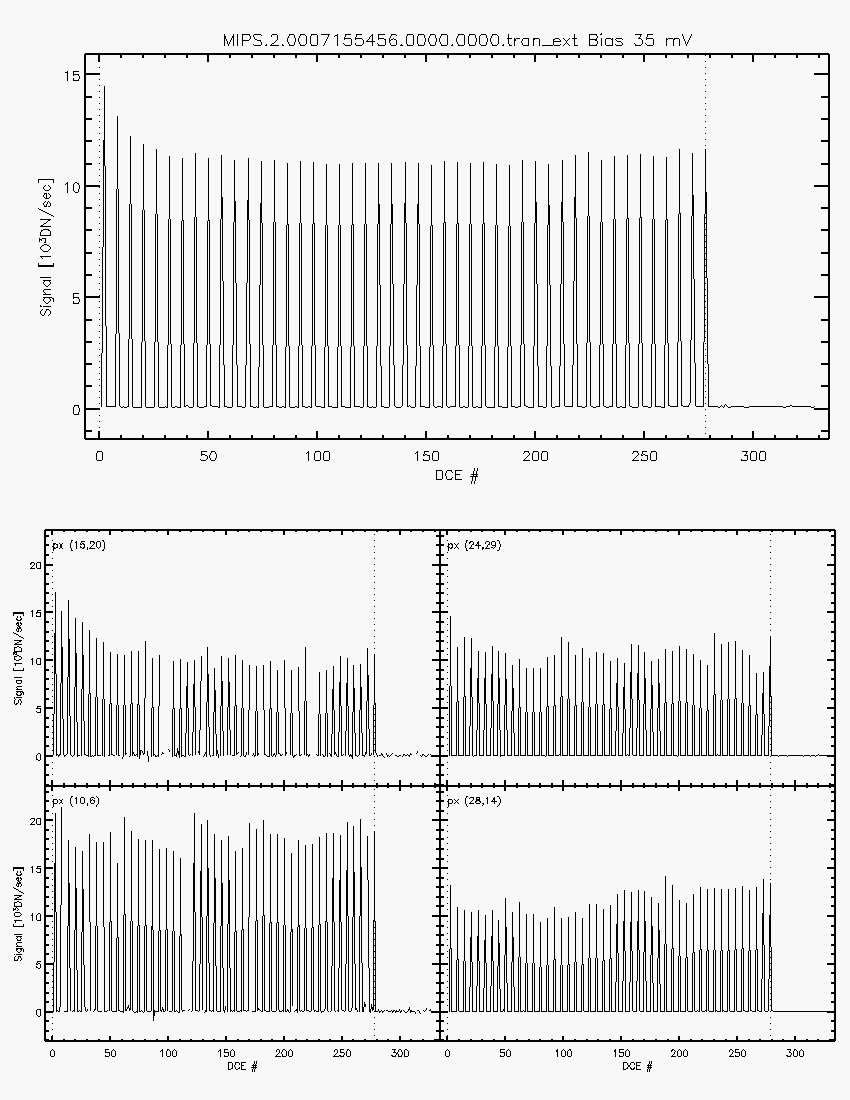
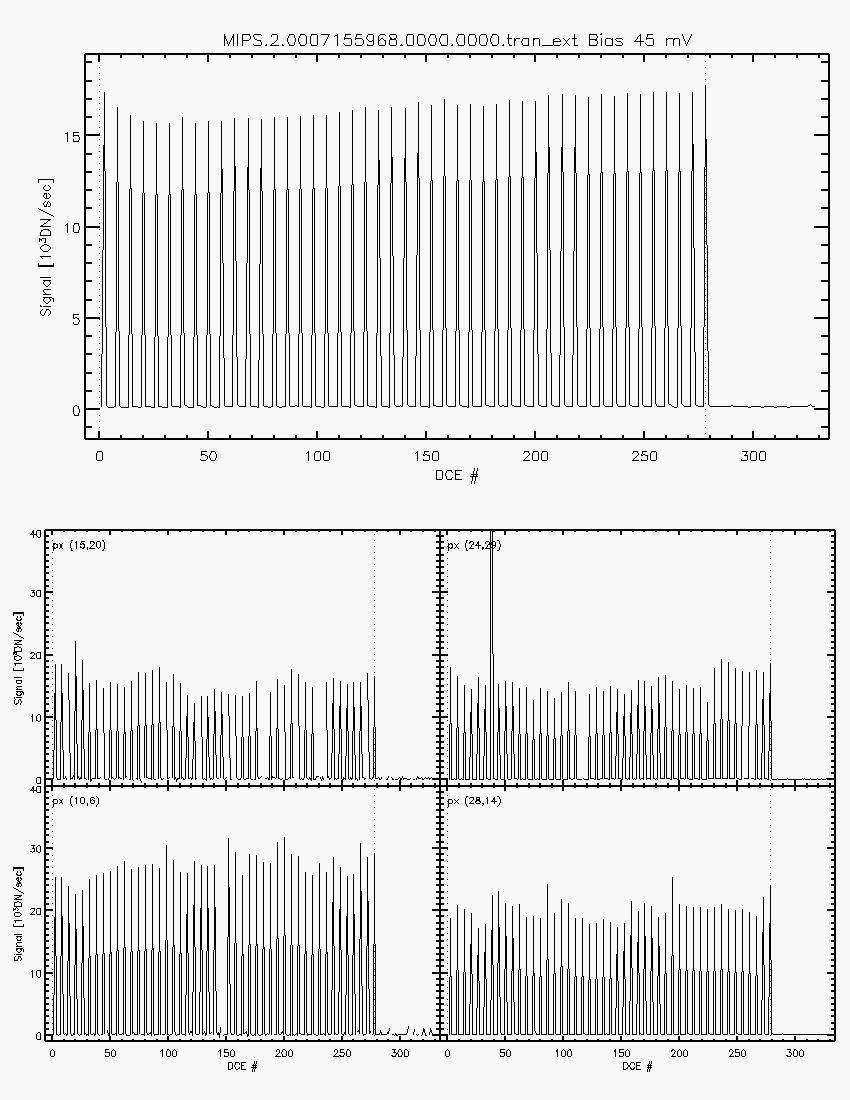
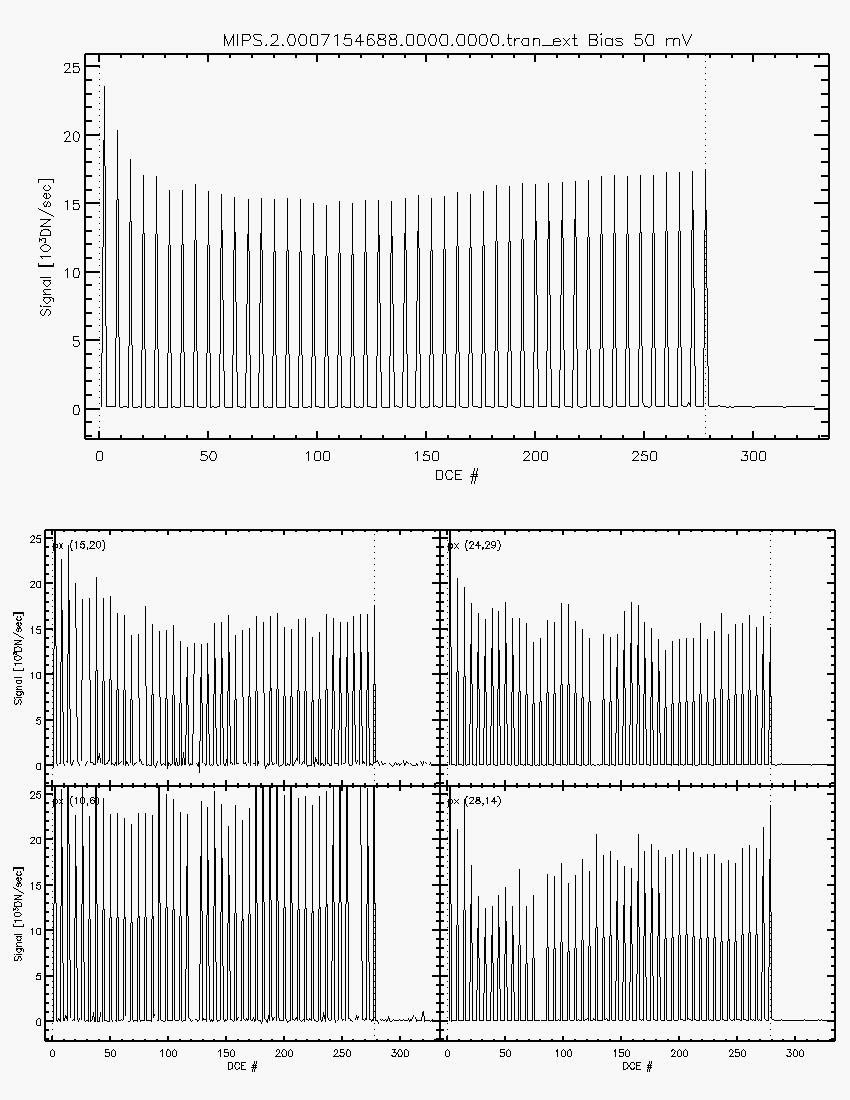
For each bias voltage, we measured 278 DCEs with a stim flash on the 2nd
DCE and every 6 DCEs after that, for a total of 47 stim flashes. The IDL
routines mips246_stimcal and mips246_darkcal and Karl Misselt's stim
repeatability routine provided the following results:
70um Analysis:
AORID 70Bias 160Bias   Mean Stim      Stim  K.M.StimRep    Dark     Time Since
         (mV)   (mV)   (DN/s)        StdDev   (sigma)     (DN/s)    Anneal (h)
                                             70  160                  70  160
7152640   30    15    9106 +/- 296   .0138   8.8 10.5   105 +/- 18     0   2+
7155200   30    20    8872 +/-  78   .00863  7.0         86 +/- 20     1   0
7152896   35    20                           9.7                       0   1
7155456   35    25   10477 +/- 178   .0103   7.4        103 +/- 37     1   0
7153152   40    25   11404 +/- 388   .00811  9.6         78 +/-158     0   1
7153408   40    30   11664 +/- 161   .0122   ---        109 +/- 31     0   0
7155712   40    35   13102 +/- 305   .00767  6.7        140 +/- 66     1   0
7152384   45    35   13022 +/- 302   .0116   9.3        122 +/- 91     0   1
7155968   45    15   15366 +/- 408   .00770  6.3 10.4   154 +/- 21     1   0
7154688   50    15   14727 +/- 684   .0130   9.0 10.7   140 +/- 81     0+  1+
A downlink occurred prior to 7154688 and 7152640, which is why the time since
the last anneal is larger than the value listed in the table. I do not know
the duration of the downlink.
John Stansberry has produced plots of brightness vs DCE number for the stim-calibrated dark data. This includes array averages and is very useful for assessing stim repeatability and responsivity drifts. For the 160um data, the repeatability is good for 15mV and 20mV bias and becomes terrible starting at 25mV bias (in great part due to heavy saturation at this and higher biases). For the 70um array, there is no obvious trends in repeatability with bias voltage. These plots are presented below:
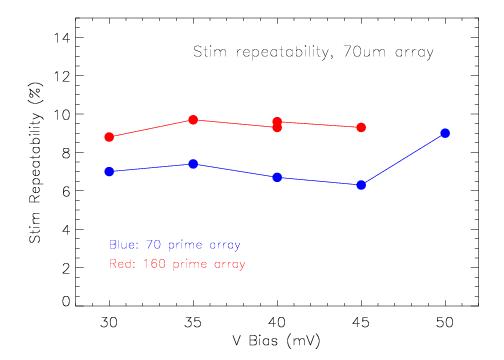
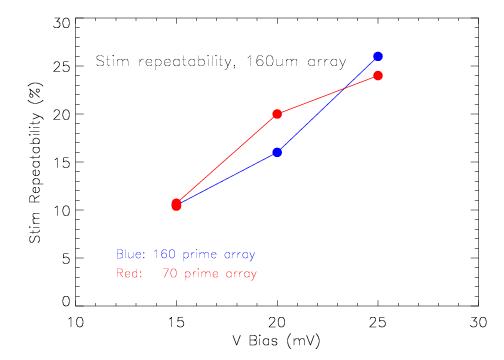
Karl Misselt produced plots of repeatability vs bias for both of the arrays. For the 160um array, the repeatability is always poor, and it degrades rapidly with increasing bias. For the 70um array, there is a dependence on settling time but no dependence on bias voltage. The one discrepent point at 50mV in the plot below was actually taken with zero settling time and so should have been plotted in red.
160_RepeatabilityVsBias.jpg
Conclusions
It is pretty clear that we want to reduce the 160um bias to either
15 or 20mV, with 15mV being slightly favored. The main criteria
in this assessment are the ramp shapes and the stim repeatability.
From the John S plots, the repeatability looks to be slightly better
at 15mV, and we think that we can make it better by increasing the
stim brightness by about 30%. For the 70um array, the responsivity
and noise both grow roughly linearly with bias. This is a bit
surprising since ground tests showed that responsivity grows with
the square of the detector bias, as expected by detector physics.
The stim repeatability is noticeably better an hour after an anneal
than it is immediately following an anneal, but there is no obvious
dependence on bias voltage. The plan for campaign J is to update
the mips-irs patch block to use a 160um bias voltage of 15mV and
a 70um bias voltage of 55mV. We will explore 70um bias voltages
from 55-70 mV in that campaign, in addition to a number of
noise-mitigating strategies for the B-side of the 70um array.
Output and Deliverable Products
None
Actions Following Analysis
None