Principal:
Deputy:
Analyst:
AORKEYS:
Last Updated:
The data were reduced with version 2.61 of the MIPS DAT. The non-default parameters used included:
|
DAT parameters |
||||||
| program | band (µm) | parameter | comment | |||
| mips_sloper | 24 | -t | read-2 correction (see below) | |||
| mips_caler | 24 | +m -F | scan mirror dependent flats (see below) | |||
| mips_enhancer | 24 | -IB | reject boost frames (FSW fix needed) | |||
| mips_enhancer | 24 | -dy -W2 -t 2 -SC 8 -SK | recommended flux-conserving parameters | |||
| mips_sloper | 70 | -l | disable electronic nonlinearity correction (updated calibration file needed) | |||
| mips_sloper | 70 | -n | flag side B as bad | |||
| mips_caler | 70 | -P mips_caler70.param | use array-specific parameter file | |||
| mips_sloper | 160 | -l | disable electronic nonlinearity correction (updated calibration file needed) | |||
| mips_caler | 160 | -P mips_caler160.param | use array-specific parameter file | |||
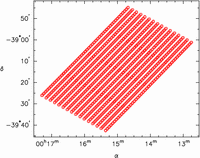
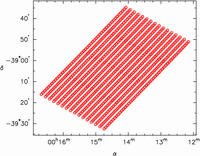
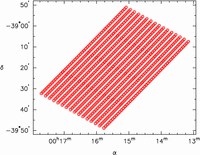
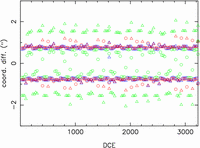
This large dataset (3,232 DCEs in each of the 3 MIPS bands) lends itself to a statistical evaluation of the pointing information contained in the image headers. I first examined the data for any anomalous pointing information in any of the ~10,000 DCEs. As shown in Figure 1, the data points all lie in very regular grids that follow the scan pattern on the sky. No wildly discrepant points are found.
 |
 |
 |
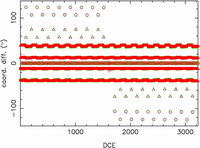
I also analyzed the differential performance of the pointing reconstruction. The left-hand panel of Figure 2 shows the coordinate differences between DCEs over the full range of this dataset. The clusters of points on the graph correspond to the different offset regimes in the scan map. For example, the middle row (near 0) corresponds to the separation between the last and first DCEs of each stimcycle. They are near zero so the last DCE of each cycle can serve as the background for the stimflash in the next cycle. The two rows near ±12 represent the RA and DEC differences of the 1-160µm-pixel jump, while the two rows outside that (near ±40) represent the RA and DEC differences of the 3-160µm-pixel jump. Finally, the widely-spaced clusters of points at the top and bottom of the plot illustrate the offsets during turnarounds between scan legs. The discrepant point in the middle of the sequence occurs at DCE 1616, i.e., at the transition between the forward and reverse scans, and is not expected to line up as well as the other points.
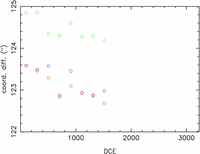
The middle panel of Figure 2 expands the region around zero. Ideally, all these points would lie within a few tenths of an arcsecond of zero, but these scans were performed before the scan map parameters were optimized to minimize the separation between the first and last DCEs of a cycle. The 24µm and 160µm arrays are closely aligned and the coordinate differences thus lie nearly on top of one another, although there are occasional discrepant points at 160µm. The 70µm array is not projected on the sky in the same orientation as the other two arrays and thus the array center difference measurements are offset slightly.
The right-hand panel of Figure 2 expands the region around the scan leg offsets from the forward scan. As in the middle panel, the 24µm and 160µm offsets often line up well, but are not always the same. In this plot, it appears that 160µm offsets follow a smoother progression than the 24µm offsets.
 |
 |
 |
The default DAT processing worked well to process the data, with changes to the flat-fielding procedure being the only requirement for producing cosmetically-pleasing images. The results of several flat-fielding approaches are illustrated in Figure 3. The default flat field (i.e., no scan-mirror dependence), as expected, leaves many residuals in the data, including the dark stripes shown in Figure 3 and the spots shown in Figure 4. The scan-mirror-dependent flat distributed with the DAT eliminates the spots but leaves the dark stripes. It also introduces a shallow gradient in the scan direction which is most apparent at the either end of the scan legs. Using the read-2 correction eliminates this gradient, but the correction can only be used with a flat that has also been processed using the correction. This specially-constructed flat eliminates the gradient, but the dark stripes are still present in the data. Also evident with this flat field are some positive images that appear to follow the scan map dither pattern on the array (see Figure 4). These are due to negative residuals in the data used to make the flat field, and likely occurred because saturating sources were scanned across the array in some observation made before the flat measurements. An extra flat field (shown in Figure 4) was made from background images in the read-2-processed data and used to flatten the data shown in the fourth panel of Figure 3. This extra flat-fielding step has removed all visible seams in the map. A similar result can be achieved by simply constructing the scan-mirror-dependent flats from the NGC 55 data themselves, as shown in the final panel of Figure 3.
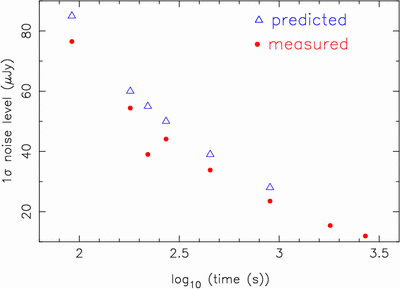
The noise performance of the array was measured in two different ways. To ensure that the noise was dominated by random fluctuations at all integration times, random stacks of images drawn from background regions of the map were averaged and the pixel statistics used to generate most of the measurements shown in Figure 5. These measurements are compared to the predicted sensitivity in the figure. Since these random stacks of images will overestimate the noise by including faint sources in the noise estimate, the measurements were compared to pixel statistics measured in source-free regions of the final mosaic shown in Figure 3. As expected, this value is lower than the curve defined by the rest of the measurements and comfortably better than the prediction.
Figure 5: 24µm sensitivity measurements at various integration times,
measured in stacks of images selected from the background. The filled point
at 220 seconds is from the mosaic in the final panel of Figure 2.
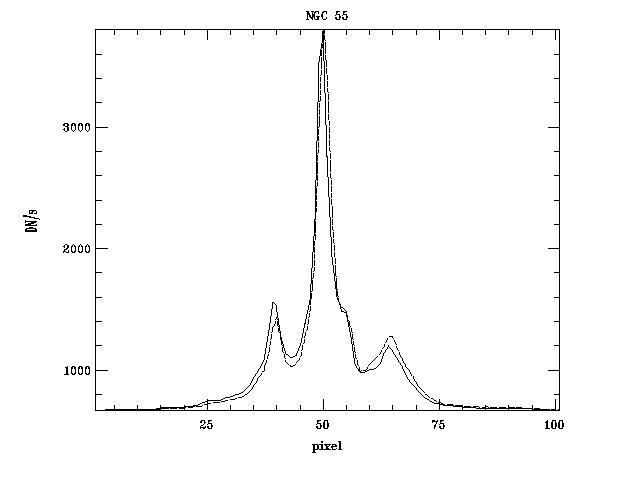
I examined the repeatability of scans in the forward and reverse direction to look for latent images or other transient behavior. No such effects are expected for this array, but it will serve as a useful comparison for the other arrays. The profiles of the forward and reverse scans over the nucleus are plotted in Figure 6. The nuclear scans repeat well. The sources on either side of the nucleus repeat less well, but examination of the image shows that the nuclear morphology is complex, being dominated by compact sources. Imperfect alignment of the crudely-extracted profiles presented here could easily result in poor matching of the off-nuclear sources.
Figure 6: Profiles of 24µm forward and backward scans over the nucleus
of NGC 55. Each curve is the average of 5 rows of pixels centered on the
nucleus. The solid line was scanned from high pixel values to low, while the
dashed line was scanned in the opposite direction.
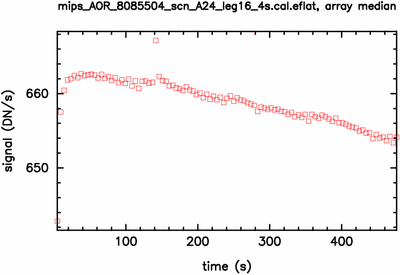
In the 3,232 24µm images in this data set, two exhibited a very strong jailbar pattern. An example is shown in Figure 7. This effect is mostly likely due to a strong cosmic ray hit changing the response of one of the 4 readouts - in each of the images where this is observed, a cosmic ray hit is evident on the affected readout. In this observation, which is mostly dominated by a smooth background, these discrepant images are easy to pick out statistically - as shown in Figure 8, a simple median of each image in a scan leg shows a deviant point after 140 seconds, where the image shown in Figure 7 appeared in the scan leg.
Figure 7: A 24µm DCE with a strong jailbar pattern due to a cosmic-ray
hit.
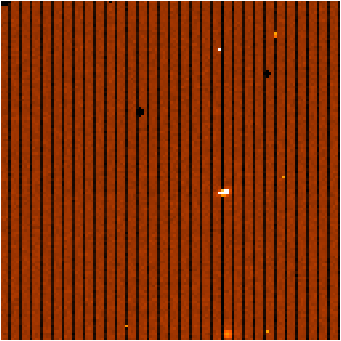
Figure 8: Median values of 24µm DCEs in one scan leg.
The 24µm array performs well on extended sources. The default data-reduction procedure (with scan-mirror-dependent flats) results in excellent images, with an extra flat-fielding step required to produce cosmetically unblemished images. The sensitivity exceeds the prediction for an observation of this duration. The repeatability of forward and backward scans is excellent.
none
The Ge:Ga analysis must still be completed.