There is a problem w/ your write-up. Check that you have valied entries for \$CAID and \$Campn in your analysis.php file. If that checks out, then Contact Stansberry"; return ; } // get first matching task $row = mysql_fetch_array($result); $title = $row["title"]; $princ = $row["principal"]; $deputy= $row["deputy"]; $campn0 = $row["campn0"]; $aorkeys = $row["aorkeys"]; // get real name of principal, deputies $princ = ioc_get_person($princ); $princ = $princ[0]; $deps = explode(",",$deputy); foreach ($deps as $depty) { $depty = trim($depty); $depty = ioc_get_person($depty); $depty = $depty[0]; $depty = explode(",",$depty); $depty = $depty[0]; // last names only $deplist[] = $depty; } $deplist = implode(", ", $deplist); $caid = sprintf("%03d",$caid); $file = "mips-".$caid.$campn.".analysis.php"; // if more matches, append the AORKEYS from those $numrows = mysql_num_rows($result); if ($numrows > 1) { $aorkeys = " " . $numrows . " Task Executions:  ". $aorkeys; for ($i=0;$i < mysql_num_rows($result); $i++) { $row = mysql_fetch_array($result); $morekeys = $row["aorkeys"]; $aorkeys = $aorkeys .';  '.$morekeys; } } // END PHP. ?> <? echo "MIPS-$caid, Campaign $campn IOC/SV Analysis"; ?>

Principal:
Deputy:
Analyst:
AORKEYS:
Last Updated:


Task Outcome Summary


Abstract

We have constructed the 70micron Narrow Field (NF) IC. The standard deviation of the 70micron IC over the entire array is 75%, but this statistics includes the illumination pattern of the 70micron array.

Analysis

We have observed a 70micron narrow-field photometry cluster-target AOR with 3 second DCEs and 6 pointings in a rectangular pattern (2x3, with 300 arcsec offsets) for a region of sky free of bright 70micron point-sources. The total number of DCEs is 132 times 2 observations for a total of 169 DCEs in the final combined image.

The reduction was performed with the DAT programs. We used mips_sloper with sensitive cosmic ray detection (-q option) turning off the electronic non-linearity correction, mips_caler (using the me_70_darka_CamX1_18nov2003.fits) and mips_enhancer with the following options:

verbose = 0
scale = 1.
filename = ic70_scan
prefix = ic_scan70
nXTile = 1
nYTile = 1
dark = 0
flat = 0
illumination_correction = 1
NormalizeInput = 1
SigmaCut = 3.0
SigmaTolerance = 0.25
MaxIterations = 10
StackSTDEV = 0
OutlierMinPoints = 3
QuartileFactor = 10
OverlapTolerance = 0.5
diagonistics = 1
WriteGeometry = 0
WriteOutlier = 0
WriteTiles = 0
FluxMean = 0
FluxMedian = 1
OverWrite = 1
distortion = 0
UseBoostFrame = 1
reject = 1
NormalizeSideA = 1


Note that we rejected the first DCE after the stim flash (reject = 1 option) and normalized the input images (NormalizeInput = 1 option) using Side-A only (NormalizeSideA = 1).

The observed region of the sky was:

zodi_30a (RA=22:43:46.2538 and Dec=-02:39:36.9610 J2000) with a predicted brightness at 70microns of 12.6 MJy/sr,

The predicted values of the 70micron brightness are from SPOT for the date of the observing (Nov 16, 2003).


Results

The NF 70micron IC is shown in Figure1. Statistics on the images provides the following:

PHOT (132DCEs) zodi_30a: mean= 0.36346; median= 0.65467; sdtdev= 0.74719; skew=-0.30120;

The histograms are shown in Figure2.


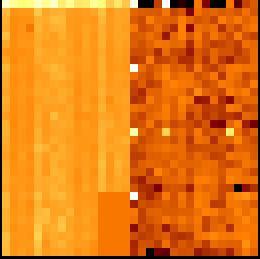
Figure1. The 70micron Illumination Correction obtained in NF mode displayed from z1=-6.209742 z2=6.495448.
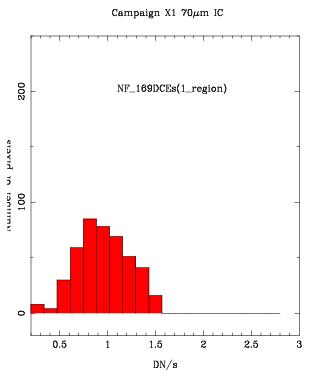


Figure2. Histogram of the 70micron Illumination Correction observed in Campaign X1 obtained in NF mode.
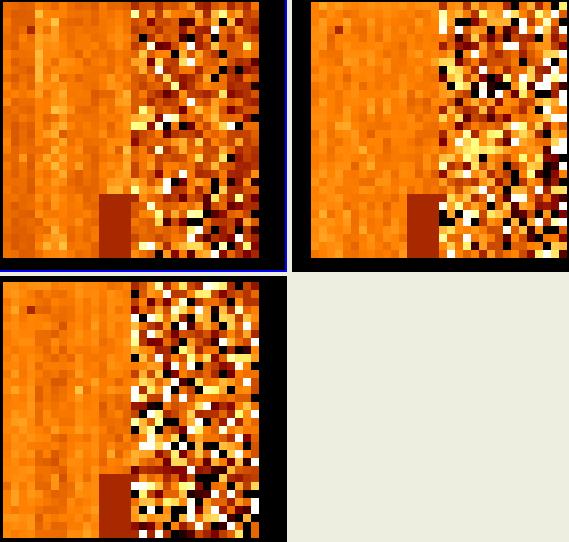

A better way to assess the quality of the observed ICs is to remove the illumination pattern of the 70micron array. To do so, we ratioed different 70micron IC, one made with half of the DCEs and the other with the remaining half. The statistics (mean, std, median, mode, skewness, min, max) on the images provides the following:

ratio ICs NF(85DCEs)/SCAN(85DCEs): 1.457    7.649    0.9706    0.9833    23.19    0.001399    208.4
Side A alone: 0.9638    0.246    0.9102    0.8803    1.098    0.5704    1.857
Side B alone: 2.035    11.26    0.7642    0.5642    15.67    0.001399    208.4


The ratio of 70micron ICs is shown in Figure3. Note that the rms for the ratio of two ICs has increased in comparison to what we got in previous campaigns. This is surely related to the fact that the array was annealed between the first and second datasets (task 930). This is proved when comparing the ICs made with the two halves of each dataset:

ratio ICs NF(43DCEs)/SCAN(43DCEs) (before anneal): 2.076    10.    1.204    1.135    18.93    0.01573    244.4
Side A alone: 1.052    0.1603    1.032    0.9438    0.4285    0.6368    1.581
Side B alone: 3.344    14.88    1.241    0.7596    12.62   0.01573    244.4

ratio ICs NF(43DCEs)/SCAN(43DCEs) (after anneal): 1.81    5.718    0.9879    0.8938    17.02    8.086E-4    134.1
Side A alone: 1.021    0.1809    1.025    0.9947    0.06297    0.5194    1.845
Side B alone: 2.835    8.564    1.236    0.429    11.28    8.086E-4    134.1


Figure3. Ratio of 70micron Illumination Corrections. Up-left: ratio of two ICs, one made with half of all the DCEs taken in Campaign X1 and the other with the remaining half. Up-right: half-to-half of all the data taken before anneal (task 930). Bottom-left: half-to-half of all the data taken after anneal. Cuts are z1=-2. z2=4. in all cases.


Conclusions

We have constructed 70micron ICs obtained in NF mode using one region of the sky (zodi_30a). The standard deviation of the 70micron IC over the entire array is approximately 75%, but this statistics includes the illumination pattern of the 70micron array. If we remove the illumination pattern by ratioing two NF ICs, we find that the rms is approximately 25% in side A. This value turns into about 17% if we compare data taken before and after an anneal (task 930) separately.

Output and Deliverable Products

70micron IC to be used to reduce data obtained in campaign X1.

Actions Following Analysis