Contact Stansberry - ";
echo " there is a problem w/ your write-up.\n";
return ;
}
$row = mysql_fetch_array($result);
$title = $row["title"];
$princ = $row["principal"];
$deputy= $row["deputy"];
$campn0 = $row["campn0"];
$aorkeys = $row["aorkeys"];
// get real name of principal, deputies
$princ = ioc_get_person($princ);
$princ = $princ[0];
$deps = explode(",",$deputy);
foreach ($deps as $depty) {
$depty = trim($depty);
$depty = ioc_get_person($depty);
$depty = $depty[0];
$depty = explode(",",$depty);
$depty = $depty[0]; // last names only
$deplist[] = $depty;
}
$deplist = implode(", ", $deplist);
$caid = sprintf("%03d",$caid);
$file = "mips-".$caid.$campn.".analysis.php";
// END PHP.
?>
<? echo "MIPS-$caid, Campaign $campn IOC/SV Analysis"; ?>
Principal:
Deputy:
Analyst:
AORKEYS:
Last Updated:
Task Outcome Summary
- DATA STATUS: Anomalous
- The data have WCS issues identical to those seen in MIPS-100 - see
that analysis write-up for details.
- TASK OUTCOME: Nominal
Abstract
The purpose of this task is to make an early measurement of linearity on
the Si:As array. Four stars with a range of brightnesses were measured as
part of this task, and those data were supplemented by standard star
measurements from other tasks. The Si:As array calibration is quite stable
and linear, and there is some indication that there is an integration time
effect on the calibration.
Analysis
The data were analyzed in the same way that the routine standards are -
see the MIPS-920 analysis for details.
Results
The standard measurements and some ancillary data are listed in Table 1.
The observations in Table 1 are also plotted in Figure 1. The HD043107
observations suggest that the counts measured on a source are positively
correlated with integration time. If this is the case for all targets, the
two points above the curve in Figure 1 would move closer to the calibration
line and the HD043107 would move further away.
|
Table 1: Standard Star Measurements
|
| CAID |
TARGET |
F_24 |
ITIME |
COUNTS |
UNC |
CAL |
UNC |
TYPE |
|
|
(Jy) |
(s) |
DN/s |
DN/s |
(DN/s/Jy) |
(DN/s/Jy) |
|
| 315E |
HD028471 |
2.04e-2 |
10 |
2.819e3 |
7.653e1 |
1.59e5 |
4.31e3 |
G5V |
| 315E |
HD041371 |
9.64e-2 |
10 |
1.328e4 |
1.775e2 |
1.58e5 |
2.12e3 |
K0III |
| 315E |
HD042701 |
2.92e-1 |
3 |
3.804e4 |
5.866e2 |
1.50e5 |
2.31e3 |
K3III |
| 315E |
HD053501 |
1.23e+0 |
3 |
1.614e5 |
2.613e3 |
1.51e5 |
2.44e3 |
K3III |
| 100D1 |
HD053501 |
1.23e+0 |
3 |
1.611e5 |
3.559e3 |
1.51e5 |
3.33e3 |
K3III |
| 920D1 |
HD159330 |
5.40e-1 |
3 |
6.986e4 |
1.052e3 |
1.49e5 |
2.24e3 |
K2III |
| 120E |
HD159330 |
5.40e-1 |
3 |
6.974e4 |
1.028e3 |
1.49e5 |
2.19e3 |
K2III |
| 320D1 |
HD043107 |
5.84e-2 |
3 |
7.162e3 |
1.749e2 |
1.41e5 |
3.44e3 |
B8V |
| 320D1 |
HD043107 |
5.84e-2 |
10 |
7.237e3 |
2.248e2 |
1.43e5 |
4.43e3 |
B8V |
| 320D1 |
HD043107 |
5.84e-2 |
30 |
7.642e3 |
1.499e2 |
1.50e5 |
2.95e3 |
B8V |

Figure 1: Stellar calibrations plotted
vs. the predicted flux density for each star. The weighted mean calibration
is plotted as a horizontal line. Cool giants are plotted as circles, A stars
as triangles, and solar analogs as squares. 3s integrations are in red, 10s
in blue, and 30s in green.
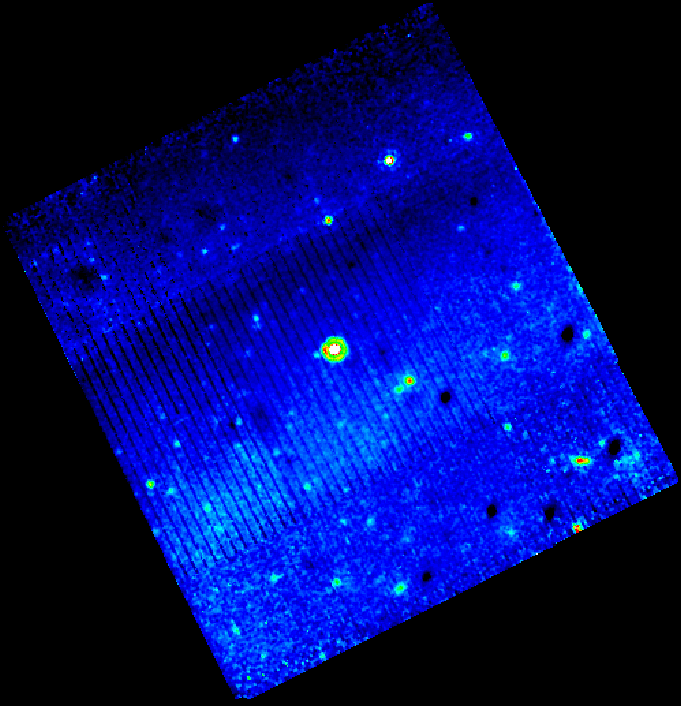
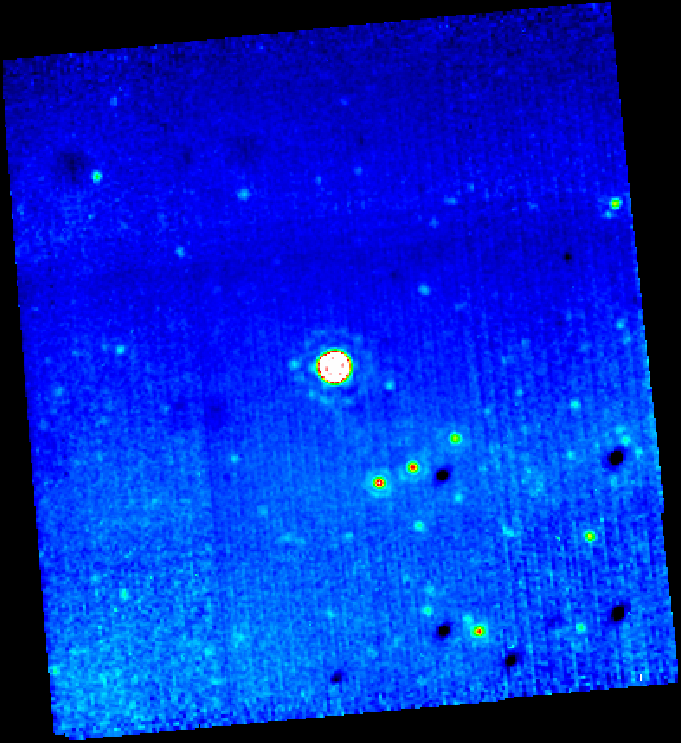
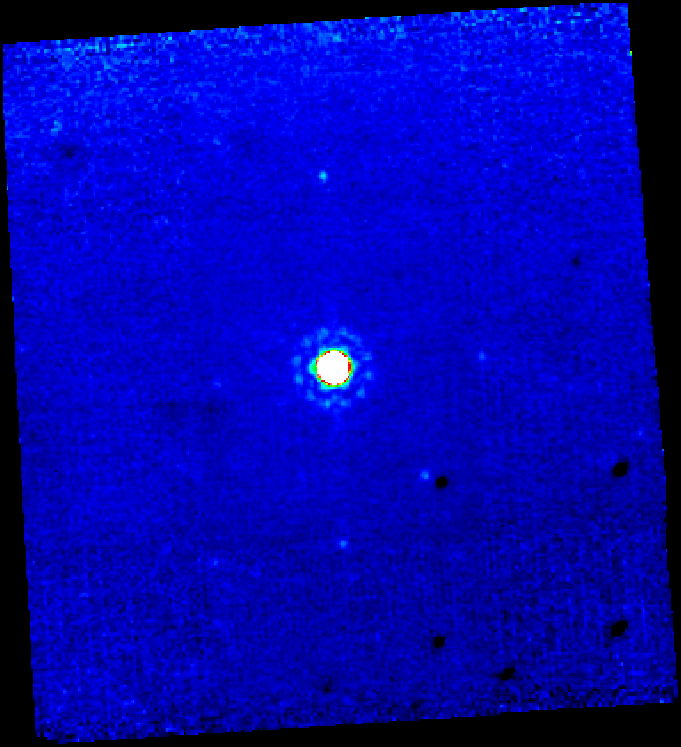
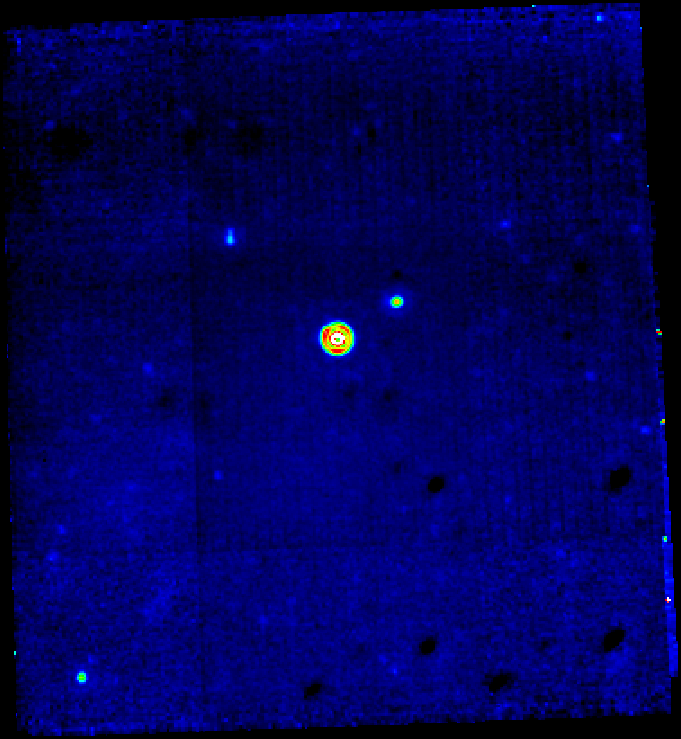
Mosaic images of the 4 new calibrators (1 of them was observed in
MIPS-320) are shown in Figures 2-5.

Figure 2: Mosaic of HD028471 images.

Figure 3: Mosaic of HD041371 images.

Figure 4: Mosaic of HD042701 images.

Figure 5: Mosaic of HD043107 images.
Conclusions
- Measurements of the same star with the same integration time are very
repeatable - the symbols fall on top of each other in Figure 1
- The calibration appears to depend on integration time, with longer
integrations providing more counts
- The four new stars analyzed in this writeup do not show any obvious
defects which would make them poor standards
Output and Deliverable Products
none
Actions Following Analysis
- Determine why the calibration depends on integration time


