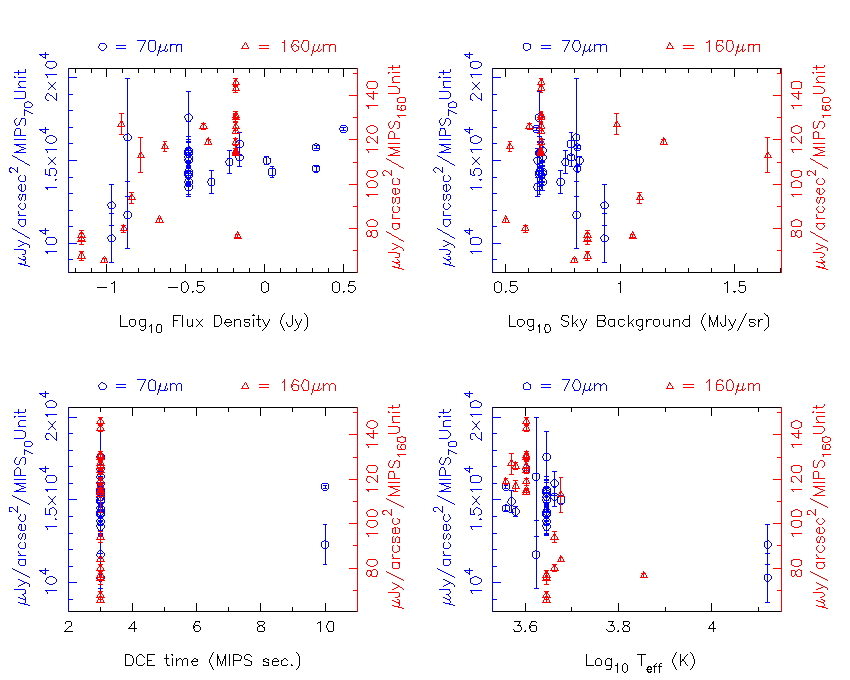
Figure 1: Calibration factors as a function of various parameters. On each panel, the 70µm data use the left-hand scale, while the 160µm data use the right-hand scale.
Principal:
Deputy:
Analyst:
AORKEYS:
Last Updated:
Unless otherwise described in the task writeups for MIPS-92[2,4] and MIPS-35[0,1,2], the data were reduced as described in the campaign R writeups for tasks 922 and 924, as appropriate. Photometry was performed as described in those task writeups.
The measured photometry can be found in the table below. The flux prediction methods are described elsewhere on this site. The sky predictions were generated using SPOT and have been tailored to the approximate observation date at 70µm.
|
Photometry |
|||||||||
| Target | CAID | Band | Predicted Flux | Predicted Sky | Measured Flux | Measured Sky | DCE Time | Spectral Type | Calibration Factor |
| |
|
(µm) | (Jy) | (MJy/sr) | (MIPS Unit) | (MIPS Unit) | (MIPS sec.) | |
(µJy/arcsec2/MIPS Unit) |
| HD002261 | 350X1 | 160 | 0.215 | 3.17 | 10.0267±0.1097 | 0.1579±0.0114 | 3 | K0III | 8.38e1±9.16e-1 |
| HD002261 | 350X1 | 70 | 1.03 | 6.64 | 0.7019±0.0126 | 0.0003±0.0016 | 3 | K0III | 1.50e4±2.69e2 |
| HD024512 | 315R | 160 | 0.437 | 15.52 | 14.3619±0.1535 | 0.4266±0.0160 | 3 | M2III | 1.19e2±1.27e0 |
| HD024512 | 9221 | 70 | 2.11 | 6.49 | 1.3613±0.0083 | 0.0001±0.0011 | 10 | M2III | 1.58e4±9.66e1 |
| HD024512 | 9221 | 70 | 2.11 | 6.49 | 1.4887±0.0151 | 0.0003±0.0020 | 3 | M2III | 1.45e4±1.47e2 |
| HD039425 | 315R | 160 | 0.096 | 6.29 | 5.7180±0.0938 | 0.2291±0.0098 | 3 | K2III | 6.56e1±1.08e0 |
| HD039425 | 315R | 70 | 0.458 | 5.49 | 0.3406±0.0174 | 0.0008±0.0023 | 3 | K2III | 1.37e4±7.02e2 |
| HD045348 | 315R | 160 | 0.673 | 11.36 | 34.3324±0.3197 | 0.4299±0.0331 | 3 | F0II | 7.66e1±7.13e-1 |
| HD050310 | 350X1 | 70 | 0.690 | 6.10 | 0.4417±0.0198 | 0.0002±0.0026 | 3 | K1III | 1.60e4±7.16e2 |
| HD050310 | 351X1 | 70 | 0.690 | 6.10 | 0.4634±0.0179 | 0.0006±0.0024 | 3 | K1III | 1.52e4±5.88e2 |
| HD050310 | 315R | 160 | 0.144 | 12.20 | 5.9891±0.1621 | 0.4153±0.0169 | 3 | K1III | 9.39e1±2.54e0 |
| HD051799 | 315R | 160 | 0.123 | 9.66 | 3.7838±0.1391 | 0.3744±0.0145 | 3 | M1III | 1.27e2±4.67e0 |
| HD051799 | 315R | 70 | 0.594 | 5.75 | 0.4070±0.0184 | 0.0001±0.0024 | 3 | M1III | 1.49e4±6.75e2 |
| HD053501 | 350X1 | 70 | 0.135 | 6.44 | 0.1176±0.0204 | 0.0005±0.0027 | 3 | K3III | 1.17e4±2.04e3 |
| HD053501 | 315R | 70 | 0.135 | 6.43 | 0.0842±0.0184 | 0.0006±0.0024 | 3 | K3III | 1.64e4±3.58e3 |
| HD089758 | 350X1 | 160 | 0.409 | 4.02 | 12.6571±0.1496 | 0.1821±0.0156 | 3 | M0III | 1.26e2±1.49e0 |
| HD096833 | 351X1 | 160 | 0.128 | 3.85 | 6.2603±0.1225 | 0.1618±0.0127 | 3 | K1III | 7.99e1±1.56e0 |
| HD100029 | 351X1 | 160 | 0.233 | 3.30 | 7.8031±0.1536 | 0.1579±0.0160 | 3 | M0III | 1.17e2±2.30e0 |
| HD100029 | 351X1 | 70 | 1.11 | 4.46 | 0.7921±0.0179 | 0.0000±0.0023 | 3 | M0III | 1.43e4±3.24e2 |
| HD131873 | 924Q | 160 | 0.656 | 4.50 | 22.3089±0.1717 | 0.2100±0.0180 | 3 | K4III | 1.15e2±8.84e-1 |
| HD131873 | 924Q | 160 | 0.656 | 4.50 | 22.4832±0.1577 | 0.2046±0.0165 | 3 | K4III | 1.14e2±7.99e-1 |
| HD131873 | 350X1 | 160 | 0.656 | 4.51 | 17.5925±0.2221 | 0.2240±0.0230 | 3 | K4III | 1.46e2±1.84e0 |
| HD131873 | 351X1 | 160 | 0.656 | 4.51 | 17.9093±0.1989 | 0.2211±0.0207 | 3 | K4III | 1.43e2±1.59e0 |
| HD131873 | 924R | 160 | 0.656 | 4.51 | 20.3119±0.3184 | 0.2049±0.0315 | 3 | K4III | 1.26e2±1.98e0 |
| HD131873 | 924R | 160 | 0.656 | 4.51 | 20.5884±0.2189 | 0.2068±0.0228 | 3 | K4III | 1.24e2±1.32e0 |
| HD131873 | 924V | 160 | 0.656 | 4.51 | 21.5706±0.2831 | 0.1812±0.0291 | 3 | K4III | 1.19e2±1.56e0 |
| HD131873 | 924W | 160 | 0.656 | 4.51 | 19.5695±0.2408 | 0.1960±0.0251 | 3 | K4III | 1.31e2±1.60e0 |
| HD131873 | 9221 | 70 | 3.14 | 4.30 | 1.8945±0.0099 | 0.0002±0.0013 | 3 | K4III | 1.69e4±8.85e1 |
| HD131873 | 9241 | 160 | 0.656 | 4.51 | 19.5078±0.2324 | 0.1755±0.0255 | 3 | K4III | 1.31e2±1.56e0 |
| HD131873 | 9241 | 160 | 0.656 | 4.51 | 19.4915±0.2521 | 0.1818±0.0276 | 3 | K4III | 1.31e2±1.70e0 |
| HD131873 | 9241 | 160 | 0.656 | 4.51 | 19.6565±0.2439 | 0.1804±0.0267 | 3 | K4III | 1.30e2±1.62e0 |
| HD131873 | 9241 | 160 | 0.656 | 4.51 | 19.6563±0.2652 | 0.2036±0.0289 | 3 | K4III | 1.30e2±1.76e0 |
| HD163588 | 922Q | 70 | 0.329 | 4.36 | 0.2244±0.0104 | -0.0006±0.0014 | 3 | K2III | 1.50e4±6.95e2 |
| HD163588 | 922Q | 70 | 0.329 | 4.36 | 0.2516±0.0107 | -0.0004±0.0014 | 3 | K2III | 1.34e4±5.69e2 |
| HD163588 | 922X1 | 70 | 0.329 | 4.42 | 0.1916±0.0168 | 0.0004±0.0022 | 3 | K2III | 1.76e4±1.54e3 |
| HD163588 | 922X1 | 70 | 0.329 | 4.42 | 0.2361±0.0211 | 0.0002±0.0028 | 3 | K2III | 1.42e4±1.27e3 |
| HD163588 | 922R | 70 | 0.329 | 4.43 | 0.2177±0.0094 | 0.0000±0.0012 | 3 | K2III | 1.55e4±6.67e2 |
| HD163588 | 922R | 70 | 0.329 | 4.43 | 0.2188±0.0279 | 0.0016±0.0037 | 3 | K2III | 1.54e4±1.96e3 |
| HD163588 | 922V | 70 | 0.329 | 4.45 | 0.2170±0.0130 | 0.0003±0.0017 | 3 | K2III | 1.55e4±9.29e2 |
| HD163588 | 922W | 70 | 0.329 | 4.52 | 0.2380±0.0097 | -0.0005±0.0013 | 3 | K2III | 1.41e4±5.76e2 |
| HD163588 | 9221 | 70 | 0.329 | 4.58 | 0.2206±0.0084 | -0.0006±0.0011 | 3 | K2III | 1.52e4±5.81e2 |
| HD163588 | 9221 | 70 | 0.329 | 4.58 | 0.2372±0.0086 | -0.0007±0.0011 | 3 | K2III | 1.42e4±5.14e2 |
| HD163588 | 9221 | 70 | 0.329 | 4.58 | 0.2447±0.0094 | -0.0006±0.0012 | 3 | K2III | 1.37e4±5.28e2 |
| HD163588 | 9221 | 70 | 0.329 | 4.58 | 0.2348±0.0093 | -0.0006±0.0012 | 3 | K2III | 1.43e4±5.67e2 |
| HD163588 | 9221 | 70 | 0.329 | 4.58 | 0.2153±0.0090 | -0.0006±0.0012 | 3 | K2III | 1.56e4±6.53e2 |
| HD163588 | 9241 | 160 | 0.069 | 7.19 | 3.5867±0.1173 | 0.2294±0.0129 | 3 | K2III | 7.51e1±2.46e0 |
| HD163588 | 9241 | 160 | 0.069 | 7.19 | 3.5111±0.0986 | 0.2380±0.0108 | 3 | K2III | 7.68e1±2.16e0 |
| HD163588 | 9241 | 160 | 0.069 | 7.19 | 3.9871±0.1176 | 0.2319±0.0129 | 3 | K2III | 6.76e1±1.99e0 |
| HD197989 | 315R | 160 | 0.164 | 44.25 | 5.6673±0.3975 | 1.0851±0.0415 | 3 | K0III | 1.13e2±7.93e0 |
| HD209952 | 351X1 | 70 | 0.107 | 8.54 | 0.1067±0.0155 | 0.0001±0.0020 | 3 | B7IV | 1.03e4±1.49e3 |
| HD209952 | 315R | 70 | 0.107 | 8.55 | 0.0890±0.0088 | 0.0004±0.0012 | 10 | B7IV | 1.23e4±1.22e3 |
The data in the table have been used to examine how the calibration factor is affected by various parameters. The data have been plotted in Figure 1.
Figure 1: Calibration factors as a
function of various parameters. On each panel, the 70µm data use the
left-hand scale, while the 160µm data use the right-hand scale.
The top-left panel of Figure 1 shows the calibration factor as a function of calibrator flux density. The data clearly show a trend with source brightness, with a 40% increase in calibration factor over a factor of 30 increase in flux density at 70µm and a steeper increase of 60% over a factor of 10 increase in flux density at 160µm. No correction for nonlinearity in the electronics has been made for these data. Due to the spectral leak, the 160µm points mimic the behavior of sources brighter by a factor of about 5. The leak behaves as expected with spectral type: the bright source far below the curve is the only hot star in the 160µm data, and thus has a larger leak (and correspondingly lower calibration factor).
The top-right panel of Figure 1 shows the calibration factor as a function of background. There are no obvious trends in the data, although there is a lot of scatter. The apparent trend at 70µm may also be due to spectral type or small-number statistics, since the two lowest points on the plot correspond to the only hot star in the 70µm data (cf. lower-right panel of Figure 1).
The lower-left panel of Figure 1 shows the calibration factor as a function of integration time. This analysis requires more data, obviously.
The lower-right panel of Figure 1 shows the calibration factor as a function of effective temperature, where I've simply converted the spectral type to a temperature using the tables in Lang's "Astrophysical Data." There are not enough data to determine if a trend is present at 70µm - as discussed above, the only points on this plot above 10,000K correspond to the same star. There is a weak trend at 160µm which has the expected behavior: hotter stars (which will have a bigger leak) imply smaller calibration factors. With the leak in this band, it may not be possible to disentangle systematic differences in flux prediction as a function of spectral type from changes in the amount of short-wavelength light that enter through the leak.
The data show some nonlinearity in the Ge:Ga detectors, which is to be expected since no linearity correction was performed on the data. The 160µm data show some effects due to spectral type, which follow the behavior expected of the spectral leak.
None