There is a problem w/ your write-up. Check that you have valied entries
for \$CAID and \$Campn in your analysis.php file. If that checks out, then
Contact Stansberry";
return ;
}
// get first matching task
$row = mysql_fetch_array($result);
$title = $row["title"];
$princ = $row["principal"];
$deputy= $row["deputy"];
$campn0 = $row["campn0"];
$aorkeys = $row["aorkeys"];
// get real name of principal, deputies
$princ = ioc_get_person($princ);
$princ = $princ[0];
$deps = explode(",",$deputy);
foreach ($deps as $depty) {
$depty = trim($depty);
$depty = ioc_get_person($depty);
$depty = $depty[0];
$depty = explode(",",$depty);
$depty = $depty[0]; // last names only
$deplist[] = $depty;
}
$deplist = implode(", ", $deplist);
$caid = sprintf("%03d",$caid);
$file = "mips-".$caid.$campn.".analysis.php";
// if more matches, append the AORKEYS from those
$numrows = mysql_num_rows($result);
if ($numrows > 1) {
$aorkeys = " " . $numrows . " Task Executions: ". $aorkeys;
for ($i=0;$i < mysql_num_rows($result); $i++) {
$row = mysql_fetch_array($result);
$morekeys = $row["aorkeys"];
$aorkeys = $aorkeys .'; '.$morekeys;
}
}
// END PHP.
?>
<? echo "MIPS-$caid, Campaign $campn IOC/SV Analysis"; ?>
Principal:
Deputy:
Analyst:
AORKEYS:
Last Updated:
Task Outcome Summary
- DATA STATUS: Nominal
- TASK OUTCOME: Incomplete (24um only so far)
Abstract
All data for the 24um observations obtained and reduced with the DAT V***. Reduced data suffer
from jail-bars in all images (not just bright targets). Aperture photometry of each target performed and
a calibration factor was derived. Most stars are fine for calibration targtes. A best linear fit to the
data yields CF = 1.5003e5 (DN/s/Jy) +/- 2335 (DN/s/Jy)
Analysis
The raw data was processed through the DAT version *** to produce 30 calibrated
DCEs per object. These were loaded into IDP3, where aperture photometry was performed
using the adopted standard apertures (see MIPS 920) and an aperture correction
AC = 1.146. The average photometric DN/s and standard deviation were calculated.
A conversion factor was derived by division of the total DN/s by the predicted
photospheric flux density in Jy.
A best estimate for the conversion factor was produced by fitting a line to all of the data with
"x" the predicted flux density and "y" the measured total DN/s from the target. The line was forced to pass
through (0,0).
Final images were constructed by careful alignment of the 30 images in the stack and median combined. The images
were not distortion-corrected, and no background has been removed.
Results
The median combined images can be found here.
Calibration:
The results of the aperture photometry are given in Table 1:
| Object |
Spectral Type |
Predicted Flux Density (Jy) |
Measured DN/s |
1-sig (%) |
Ap Corrected Flux (DN/s) |
CF (DN/s/Jy) |
1-sigCF (DN/s/Jy) |
Background (DN/s) |
BG 1sig |
BG-Sig(%) |
| HD082308 |
K5III |
4.8816 |
6.113E+05 |
4.25 |
7.005E+05 |
1.435E+05 |
6.099E+03 |
1017.84 |
11.81 |
1.16 |
| HD087901 |
B7 |
1.6089 |
2.048E+05 |
2.07 |
2.347E+05 |
1.459E+05 |
3.019E+03 |
1253.80 |
10.66 |
0.85 |
| HD096833 |
K1III |
4.6375 |
6.493E+05 |
4.36 |
7.441E+05 |
1.605E+05 |
6.996E+03 |
611.34 |
8.31 |
1.36 |
| HD138265 |
K5III |
0.9797 |
1.264E+05 |
1.83 |
1.449E+05 |
1.479E+05 |
2.706E+03 |
384.48 |
6.69 |
1.74 |
| HD152222 |
K2III |
0.3132 |
4.540E+04 |
1.82 |
5.203E+04 |
1.661E+05 |
3.023E+03 |
359.53 |
7.05 |
1.96 |
| HD154391 |
K2III |
0.2073 |
2.650E+04 |
1.95 |
3.037E+04 |
1.465E+05 |
2.857E+03 |
363.09 |
6.97 |
1.92 |
| HD158460 |
A2V |
0.0462 |
6.926E+03 |
3.34 |
7.938E+03 |
1.718E+05 |
5.737E+03 |
361.43 |
6.98 |
1.93 |
| HD158485 |
A4V |
0.0259 |
3.100E+03 |
4.94 |
3.553E+03 |
1.373E+05 |
6.781E+03 |
362.58 |
7.40 |
2.04 |
| HD159048 |
K0III |
0.2596 |
3.114E+04 |
1.71 |
3.569E+04 |
1.374E+05 |
2.350E+03 |
353.41 |
7.21 |
2.04 |
| HD163466 |
A2V |
0.0227 |
2.559E+03 |
8.28 |
2.932E+03 |
1.294E+05 |
1.072E+04 |
358.65 |
7.39 |
2.06 |
| HD163588 |
K2III |
3.3032 |
3.963E+05 |
4.78 |
4.542E+05 |
1.375E+05 |
6.572E+03 |
387.28 |
6.78 |
1.75 |
| HD165459 |
A2? |
0.0174 |
3.309E+03 |
3.85 |
3.792E+03 |
2.179E+05 |
8.391E+03 |
360.26 |
7.10 |
1.97 |
| HD166780 |
K4.5III |
0.2318 |
2.665E+04 |
1.81 |
3.055E+04 |
1.318E+05 |
2.385E+03 |
364.20 |
6.88 |
1.89 |
| HD170693 |
K1.5III |
1.4177 |
1.665E+05 |
3.34 |
1.909E+05 |
1.346E+05 |
4.497E+03 |
363.78 |
6.91 |
1.90 |
| HD172066 |
G5? |
0.0217 |
2.926E+03 |
4.67 |
3.353E+03 |
1.545E+05 |
7.215E+03 |
350.30 |
6.76 |
1.93 |
| HD172728 |
A0V |
0.0358 |
4.047E+03 |
4.35 |
4.638E+03 |
1.294E+05 |
5.628E+03 |
355.69 |
7.50 |
2.11 |
| HD173511 |
K5III |
0.2734 |
2.804E+04 |
1.74 |
3.214E+04 |
1.176E+05 |
2.046E+03 |
357.96 |
7.23 |
2.02 |
| HD173976 |
K5III |
0.3241 |
4.151E+04 |
1.88 |
4.757E+04 |
1.468E+05 |
2.759E+03 |
359.24 |
7.51 |
2.09 |
| HD174123 |
G5? |
0.0170 |
1.990E+03 |
8.22 |
2.280E+03 |
1.344E+05 |
1.104E+04 |
349.74 |
7.10 |
2.03 |
| HD176841 |
G5? |
0.0246 |
3.165E+03 |
8.33 |
3.627E+03 |
1.474E+05 |
1.228E+04 |
350.43 |
7.11 |
2.03 |
| HD180711 |
G9III |
3.5422 |
5.078E+05 |
1.99 |
5.819E+05 |
1.643E+05 |
3.269E+03 |
386.97 |
7.31 |
1.89 |
| HD189276 |
K5Iab |
2.8151 |
3.388E+05 |
2.12 |
3.883E+05 |
1.379E+05 |
2.924E+03 |
385.91 |
6.75 |
1.75 |
| HD191854 |
G5 |
0.0354 |
4.229E+03 |
4.58 |
4.847E+03 |
1.369E+05 |
6.270E+03 |
457.91 |
7.24 |
1.58 |
| HD216131 |
G8II |
2.2232 |
2.864E+05 |
1.92 |
3.282E+05 |
1.476E+05 |
2.834E+03 |
592.69 |
7.94 |
1.34 |
| HD217382 |
K4III |
2.0289 |
2.858E+05 |
1.85 |
3.276E+05 |
1.614E+05 |
2.987E+03 |
381.14 |
6.94 |
1.82 |
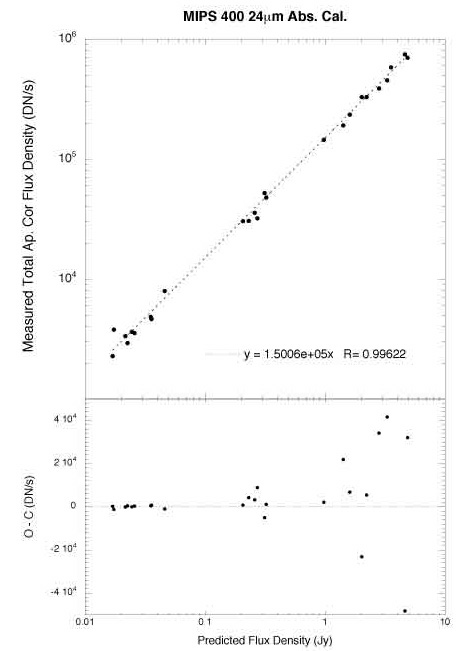
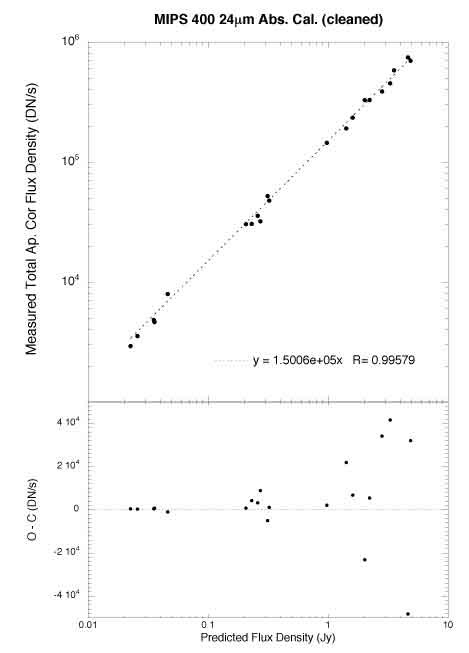
These results are plotted in Figures 1 & 2. Figure 1 contains all of the data,
while figure 2 contains only those stars with good spectral types. There is
some indication of a nonlinearity for objects above 2Jy.

Figure 1: Top - Best linear fit to all of the MIPS-400 24um data. Bottom -
Residuals from fit.

Figure 2: Top - Best linear fit to the MIPS-400 24um data for those stars
with good spectral types. Bottom - Residuals from fit.
Calibration Versus Other Parameters:
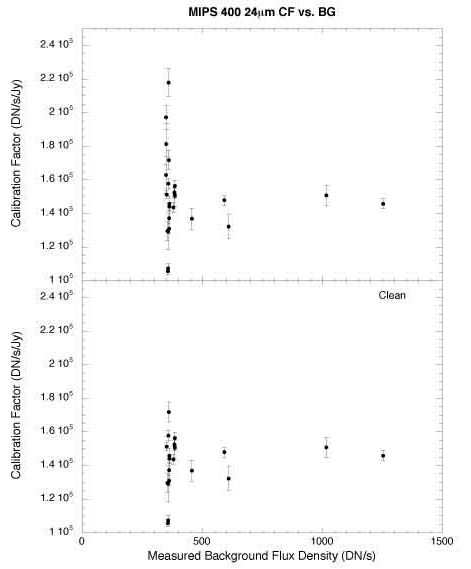
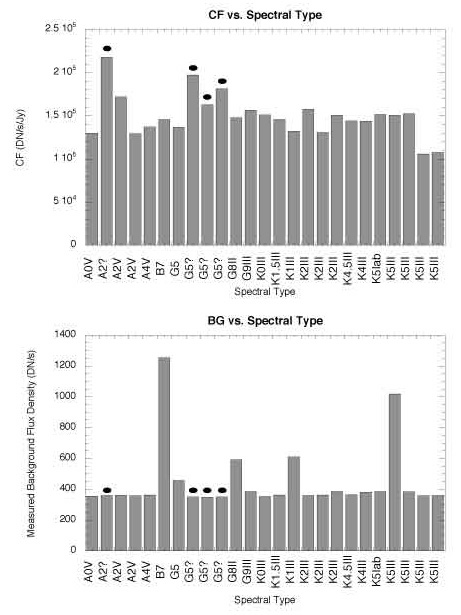
Figures 3 & 4 show the Calibration Factor versus measured background and spectral
type. No obvious trends are seen.

Figure 3: Calibration factor vs. measured background. Top - All data. Bottom
- Only those stars with good spectral types.

Figure 4: Top - Calibration factor vs. spectral type. Bottom - The measured
backgrounds around each star.
Conclusions
The absolute calibration of 24um does not depend on background or spectral type.
Some non-linearity may be present for objects above 2Jy.
All objects appear to be free of obvious excesses above their predicted photospheres.
HD172066 lies in a cluttered field so may not be a desirable targte. HD191854
lies in a very patchy, diffuse background.
There are still significant issues in the pipeline data reduction that are causing
jail-bars and instrumental variations in the background.
Output and Deliverable Products
The absolute calibration factor is CF = 1.5003e5 (DN/s/Jy)
+/- 2335 (DN/s/Jy)
Actions Following Analysis
The jail bar problem should be fixed. Accurate spectral types for the few stars that lack these data must be obtained. Analysis for 70um and 160um must be completed.


