There is a problem w/ your write-up. Check that you have valied entries for \$CAID and \$Campn in your analysis.php file. If that checks out, then Contact Stansberry"; return ; } // get first matching task $row = mysql_fetch_array($result); $title = $row["title"]; $princ = $row["principal"]; $deputy= $row["deputy"]; $campn0 = $row["campn0"]; $aorkeys = $row["aorkeys"]; // get real name of principal, deputies $princ = ioc_get_person($princ); $princ = $princ[0]; $deps = explode(",",$deputy); foreach ($deps as $depty) { $depty = trim($depty); $depty = ioc_get_person($depty); $depty = $depty[0]; $depty = explode(",",$depty); $depty = $depty[0]; // last names only $deplist[] = $depty; } $deplist = implode(", ", $deplist); $caid = sprintf("%03d",$caid); $file = "mips-".$caid.$campn.".analysis.php"; // if more matches, append the AORKEYS from those $numrows = mysql_num_rows($result); if ($numrows > 1) { $aorkeys = " " . $numrows . " Task Executions:  ". $aorkeys; for ($i=0;$i < mysql_num_rows($result); $i++) { $row = mysql_fetch_array($result); $morekeys = $row["aorkeys"]; $aorkeys = $aorkeys .';  '.$morekeys; } } // END PHP. ?> <? echo "MIPS-$caid, Campaign $campn IOC/SV Analysis"; ?>

Principal:
Deputy:
Analyst:
AORKEYS:
Last Updated:


Task Outcome Summary


Abstract

We have constructed the 70micron IC obtained in SCAN mode. The standard deviations of the 70micron ICs over the entire array are approximately 25%, but this statistics includes the illumination pattern of the 70micron array.

Analysis

We have observed 2 degrees (1 leg) in fast mode for three different regions of the sky (zodi_13b, zodi_28b, and zodi29a). Note that two of the 70micron regions were observed in MIPS-914 and MIPS-916.

Since these tasks are repeated a number of times during IOC, we will observe different regions of the sky each time. The tasks will check for possible variations of quality of IC or saturation. This task will also be useful for screening regions of the sky to obtain ICs in SIRTF routine operations.

The reduction was performed with the DAT programs. We used mips_sloper with sensitive cosmic ray detection (-q option) turning off the electronic non-linearity correction, mips_caler (using the 70micron me_70_darka_CamP_4nov2003.fits) and mips_enhancer with the following options:

verbose = 0
scale = 1.
filename = ic70_scan
prefix = ic_scan70
nXTile = 1
nYTile = 1
dark = 0
flat = 0
illumination_correction = 1
NormalizeInput = 1
SigmaCut = 3.0
SigmaTolerance = 0.25
MaxIterations = 10
StackSTDEV = 0
OutlierMinPoints = 3
QuartileFactor = 10
OverlapTolerance = 0.5
diagonistics = 1
WriteGeometry = 0
WriteOutlier = 0
WriteTiles = 0
FluxMean = 0
FluxMedian = 1
OverWrite = 1
distortion = 0
UseBoostFrame = 1
reject = 1


Note that we rejected the first DCE after the stim flash (reject = 1 option) and normalized the input images (NormalizeInput = 1 option).

The regions of the sky observed were:


zodi_13b (RA=21:05:07.4259 and Dec=-21:54:04.3864, J2000) with a predicted brightness at 70microns of 14.2 MJy/sr.
zodi_28b (RA=21:32:18.5321 and Dec=-19:52:22.7257, J2000) with a predicted brightness at 70microns of 14.4 MJy/sr,
zodi_29a (RA=21:49:42.1042 and Dec=-7:49:51.7263, J2000) with a predicted brightness at 70microns of 11.7 MJy/sr,


The predicted values of the 70micron brightness are from SPOT for the date of th e observing (Nov 3, 2003).


Results

The SCAN mode 70micron IC constructed using 460DCEs observed in Campaign P is shown in Figure1. An IC resulting from the combination of the 920DCEs from Campaigns O and P is also shown. Statistics on the images provides the following:


SCAN three reg (480DCEs): mean= 0.96734; median= 0.95091; sdtdev= 0.24674; skew= 0.20413;
SCAN six reg (960DCEs): mean= 0.97991; median= 0.95175; sdtdev= 0.23925; skew= 0.19934;
SCAN zodi13b (160DCEs): mean= 0.96324; median= 0.95099; sdtdev= 0.24920; skew= 0.18946;
SCAN zodi28b (160DCEs): mean= 0.97627; median= 0.94745; sdtdev= 0.24707; skew= 0.23896;
SCAN zodi29a (160DCEs): mean= 0.94579; median= 0.91119; sdtdev= 0.25903; skew= 0.15542;


The histograms are shown in Figure2.


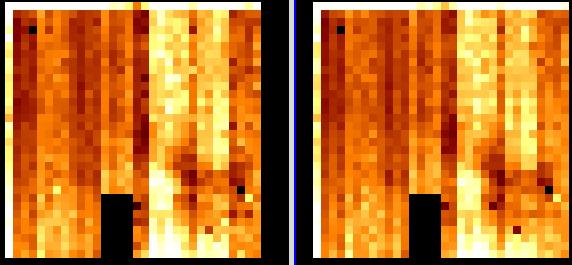
Figure1. Comparison of 70micron Illumination Corrections obtained in Campaign P (left) and Campaigns O+P (right). Both are displayed from z1=0. to z2=2.
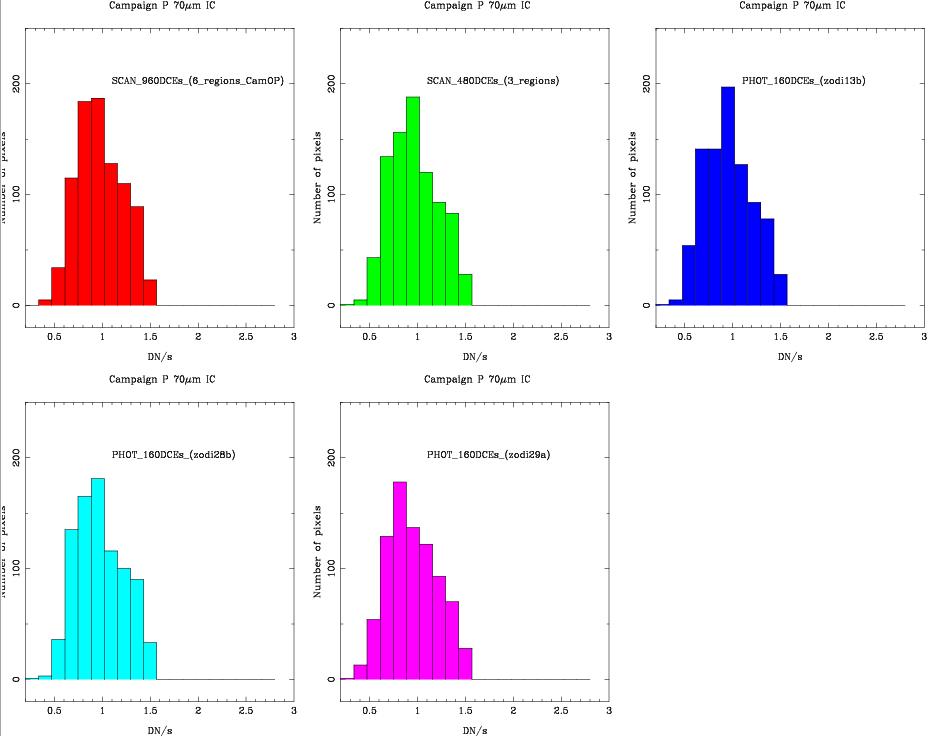


Figure2. Histograms of the 70micron Illumination Corrections observed in Campaign P obtained in different modes and different regions of the sky.


A better way to assess the quality of the observed ICs is to remove the illumination pattern of the 70micron array. To do so, we ratioed different 70micron IC. The statistics (mean, std, median, mode, skewness, min, max) on the images provides the following:

ratio ICs SCAN(480DCEs_CamO)/SCAN(480DCEs_CamP): 0.996     0.1361     0.9753     0.9629     0.4105     0.334     1.49
Side A alone: 0.9923     0.1002     0.9931     0.9688    -0.2586     0.644     1.249
Side B alone: 0.9997     0.1634     0.9619     0.9333     0.481     0.334     1.4

ratio ICs SCAN zodi13b/zodi28b: 0.9877    0.09336     0.9766     0.959     0.2414     0.494     1.322
Side A alone: 0.9844    0.09237     0.9716     0.9666     0.7436     0.7472     1.322
Side B alone: 0.9908    0.09426     0.9886     0.9331    -0.2053     0.494        1.26

ratio ICs SCAN zodi13b/zodi29a: 0.9978     0.1319     0.9782     0.9564     0.6258     0.4498     1.469
Side A alone: 0.9958     0.1134     0.9804     0.9607     0.5386     0.7405     1.469
Side B alone: 0.9997     0.1474     0.9764     0.9277     0.6251     0.4498     1.468

ratio ICs SCAN zodi28b/zodi29s: 1.013     0.1278     0.997     0.9801     0.5597     0.6785     1.488
Side A alone: 1.015     0.1095     1.007     0.979     0.1353     0.6996     1.325
Side B alone: 1.01     0.1432     0.9869     0.9876     0.7423     0.6785     1.488


Some examples of the ratios of 70micron are shown in Figure3. The statistics on the best cases provides 9% rms over the array, a results which is somewhat larger than Campaign K for side A, but considerably better for side B.


Figure3. Examples of ratios of 70micron Illumination Corrections: up-left: Campaign O to Campaign P, up-rigth: scan zodi_13b to scan zodi_28b, bottom-left: scan zodi_13b to scan zodi_29a, bottom-right: scan zodi_28b to scan zodi_29a. All images are shown with z1=0 and z2=2.


We have also compared the ICs in Campaign O and P for the two regions in common: zodi_13b and zodi_28b. The results are:

ratio ICs SCAN zodi_13b CamO/CamP: 0.9996        0.17     0.9834     0.9191     0.1813     0.2483     1.461
Side A alone: 0.9964     0.1432     0.9937        1.01    0.09084     0.587     1.461
Side B alone: 1.003     0.1927     0.9812     0.946     0.1877     0.2483     1.444

ratio ICs SCAN zodi28b CamO/CamP: 0.9879     0.1333     0.9725     0.9058     0.3908     0.4958     1.461
Side A alone: 0.9809     0.1072     0.9763     0.905    0.02296     0.6611     1.305
Side B alone: 0.9944     0.1539     0.9675     0.9615     0.4224     0.4958     1.461


Actually, the brightness of zodi_28b in Campaign O is closer to the brightness of zodi_13b in Campaign P, but the figures are very similar to the ones given above:

ratio ICs SCAN (zodi_28b CamO)/(zodi_13b CamP): 1.002     0.1442     0.9866     0.9955     0.4479     0.4645     1.499
Side A alone: 1.002     0.1244     0.9961     0.9969     0.2116     0.6789     1.423
Side B alone: 1.002     0.1611     0.9819     0.9893     0.5365     0.4645     1.499


Conclusions

We have constructed 70micron ICs (wide field) obtained in PHOTOMETRY and SCAN modes using three regions of the sky (zodi13b, zodi28b, zodi_29a). The standard deviations of the 70micron ICs over the entire array are approximately 25%, but this statistics includes the illumination pattern of the 70micron array. If we remove the illumination pattern by ratioing two SCAN ICs, we find that the rms is 9%-14%. The comparison of Campaigns O and P provides approximately the same values (480DCEs each).

Output and Deliverable Products

70micron IC to be used to reduce data obtained in campaign P.

Actions Following Analysis