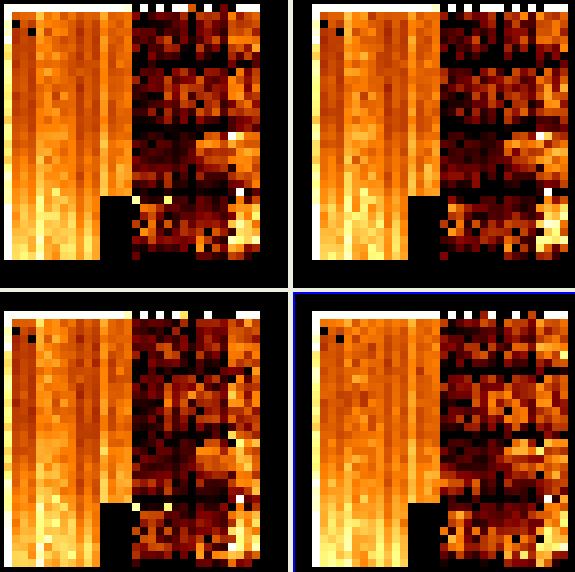
Figure1. Comparison of 70micron Illumination Corrections obtained in SCAN mode for the three regions observed in Campaign R (up-left), zodi14a (up-right), zodi14b (bottom-left) and zodi29a (bottom-right). Both are displayed from z1=0. to z2=2.
Principal:
Deputy:
Analyst:
AORKEYS:
Last Updated:
We have observed 1 degree (1 leg) in fast mode for three regions of the sky (zodi14a, zodi14b, zodi29a), with a total of 166 times 3 (regions) DCEs. The final IC combines 465DCEs.
Since these tasks are repeated a number of times during IOC, we will observe
different regions of the sky each time. The tasks will check for possible
variations of quality of IC or saturation. This task will also be useful for
screening regions of the sky to obtain ICs in SIRTF routine operations.
The reduction was performed with the DAT programs. We used mips_sloper with
sensitive cosmic ray detection (-q option)
turning off the electronic non-linearity correction, mips_caler (using
the me_70_darka_CamR_20nov2003.fits)
and mips_enhancer with the following options:
verbose = 0
scale = 1.
filename = ic70_scan
prefix = ic_scan70
nXTile = 1
nYTile = 1
dark = 0
flat = 0
illumination_correction = 1
NormalizeInput = 1
SigmaCut = 3.0
SigmaTolerance = 0.25
MaxIterations = 10
StackSTDEV = 0
OutlierMinPoints = 3
QuartileFactor = 10
OverlapTolerance = 0.5
diagonistics = 1
WriteGeometry = 0
WriteOutlier = 0
WriteTiles = 0
FluxMean = 0
FluxMedian = 1
OverWrite = 1
distortion = 0
UseBoostFrame = 1
reject = 1
NormalizeSideA = 1
Note that we rejected the first DCE after the stim flash (reject = 1 option)
and normalized the input images (NormalizeInput = 1 option)
using Side-A only (NormalizeSideA = 1).
Figure1.
Comparison of 70micron Illumination Corrections obtained in SCAN mode for the
three regions observed in Campaign R (up-left), zodi14a (up-right), zodi14b (bottom-left)
and zodi29a (bottom-right). Both are displayed from z1=0. to z2=2.
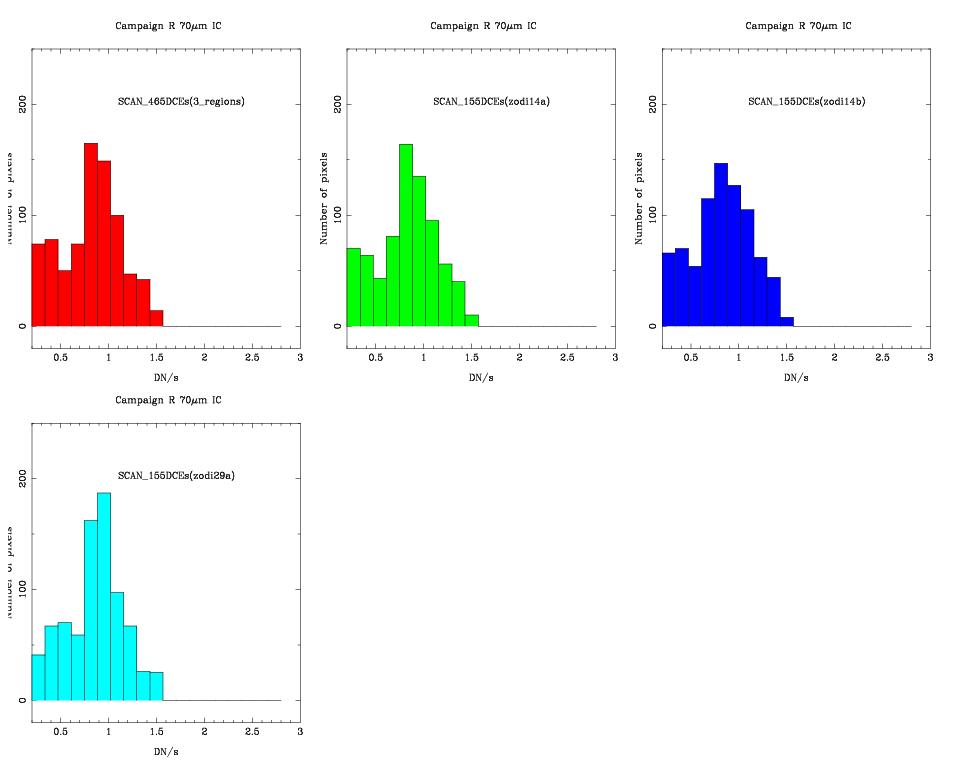
Figure2.
Histograms of the 70micron Illumination Corrections observed in Campaign R
obtained in SCAN mode.
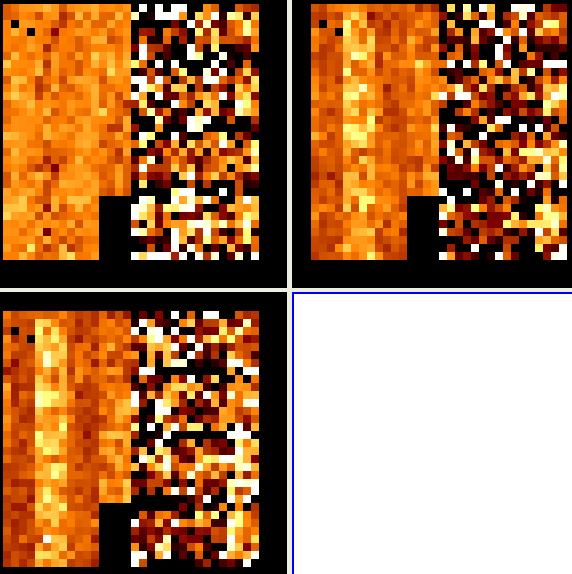
Figure3.
Examples of ratios of 70micron Illumination Corrections: up-left: zodi14a to zodi14b, up-rigth: zodi14a to zodi29a, bottom-left: zodi14b to zodi29a.
All images are shown with z1=0.5 and z2=1.5