There is a problem w/ your write-up. Check that you have valied entries for \$CAID and \$Campn in your analysis.php file. If that checks out, then Contact Stansberry"; return ; } // get first matching task $row = mysql_fetch_array($result); $title = $row["title"]; $princ = $row["principal"]; $deputy= $row["deputy"]; $campn0 = $row["campn0"]; $aorkeys = $row["aorkeys"]; // get real name of principal, deputies $princ = ioc_get_person($princ); $princ = $princ[0]; $deps = explode(",",$deputy); foreach ($deps as $depty) { $depty = trim($depty); $depty = ioc_get_person($depty); $depty = $depty[0]; $depty = explode(",",$depty); $depty = $depty[0]; // last names only $deplist[] = $depty; } $deplist = implode(", ", $deplist); $caid = sprintf("%03d",$caid); $file = "mips-".$caid.$campn.".analysis.php"; // if more matches, append the AORKEYS from those $numrows = mysql_num_rows($result); if ($numrows > 1) { $aorkeys = " " . $numrows . " Task Executions:  ". $aorkeys; for ($i=0;$i < mysql_num_rows($result); $i++) { $row = mysql_fetch_array($result); $morekeys = $row["aorkeys"]; $aorkeys = $aorkeys .';  '.$morekeys; } } // END PHP. ?> <? echo "MIPS-$caid, Campaign $campn IOC/SV Analysis"; ?>

Principal:
Deputy:
Analyst:
AORKEYS:
Last Updated:


Task Outcome Summary


Abstract

We have constructed the 70micron (wide field) ICs obtained in PHOTOMETRY mode and SCAN modes. This report is the same for MIPS-918 (70micron PHOT IC) and MIPS-915 (70micron SCAN IC) as both modes are analyzed together. The standard deviations of the 70micron ICs over the entire array are approximately 40% (for SCAN and PHOTOMETRY mode), but this statistics includes the illumination pattern of the 70micron array.

Analysis

In PHOTOMETRY mode we obtained a 9 point dither map (1 cycle) at 70microns with 3 second DCEs of one region of the sky (zodi_28b) chosen to avoid bright point sources. The offsets between positions are 300 arcseconds. At each position of the dither pattern there are 16 images (4 of which is an stim flash), so a total of 108 sky images were obtained to construct the 70micron Illumination Correction (IC).

In SCAN mode we have observed 1 degree (1 leg) in fast mode for one region of the sky (zodi14a), with a total of 166DCEs.

Since these tasks are repeated a number of times during IOC, we will observe different regions of the sky each time. The tasks will check for possible variations of quality of IC or saturation. This task will also be useful for screening regions of the sky to obtain ICs in SIRTF routine operations.

The reduction was performed with the DAT programs. We used mips_sloper with sensitive cosmic ray detection (-q option) turning off the electronic non-linearity correction, mips_caler (using the me_70_darka_CamX1_18nov2003.fits) and mips_enhancer with the following options:

verbose = 0
scale = 1.
filename = ic70_scan
prefix = ic_scan70
nXTile = 1
nYTile = 1
dark = 0
flat = 0
illumination_correction = 1
NormalizeInput = 1
SigmaCut = 3.0
SigmaTolerance = 0.25
MaxIterations = 10
StackSTDEV = 0
OutlierMinPoints = 3
QuartileFactor = 10
OverlapTolerance = 0.5
diagonistics = 1
WriteGeometry = 0
WriteOutlier = 0
WriteTiles = 0
FluxMean = 0
FluxMedian = 1
OverWrite = 1
distortion = 0
UseBoostFrame = 1
reject = 1
NormalizeSideA = 1


Note that we rejected the first DCE after the stim flash (reject = 1 option, i.e, at the end we only use 73DCEs in PHOT mode and 155DCEs in SCAN mode) and normalized the input images (NormalizeInput = 1 option) using Side-A only (NormalizeSideA = 1).

The two regions of the sky observed were:

zodi_14a (RA=8:55:25.1305 and Dec=+12:09:32.6938, J2000) with a predicted brightness at 70microns of 14.7 MJy/sr.
zodi_28b (RA=21:32:18.5321 and Dec=-19:52:22.7257, J2000) with a predicted brightness at 70microns of 17.7 MJy/sr,


The predicted values of the 70micron brightness are from SPOT for the date of the observing (Nov 16, 2003).


Results

The PHOTOMETRY and SCAN mode 70micron ICs constructed using 76DCEs and 155DCEs respectively observed in Campaign X1 are shown in Figure1. Statistics on the images provides the following:

PHOT one reg (76DCEs): mean= 0.71032; median= 0.78558; sdtdev= 0.39790; skew=-0.54510;
SCAN one reg (155DCEs): mean= 0.70292; median= 0.79822; sdtdev= 0.41166; skew=-0.41672;


The histograms are shown in Figure2.


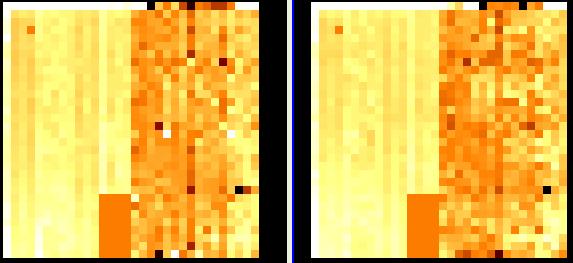
Figure1. Comparison of 70micron Illumination Corrections obtained in PHOTOMETRY (left) and SCAN modes (right). Both are displayed from z1=-2. to z2=2.
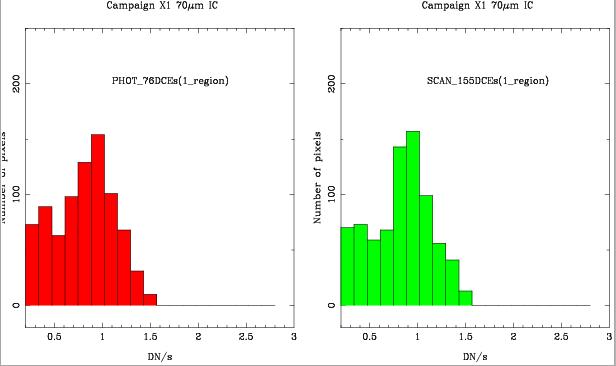


Figure2. Histograms of the 70micron Illumination Corrections observed in Campaign X1 obtained in PHOT and SCAN modes.
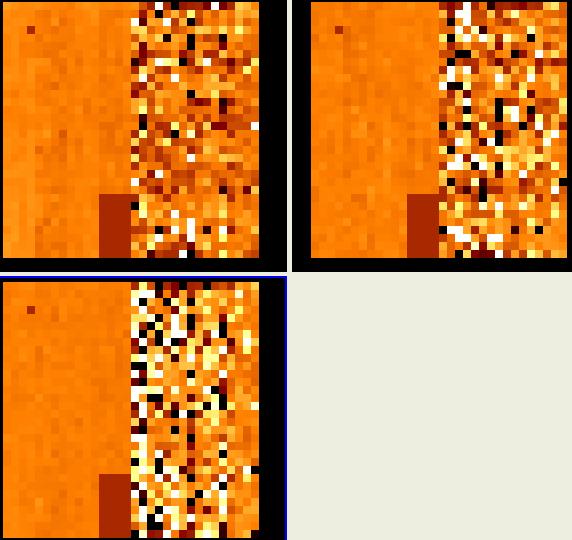

A better way to assess the quality of the observed ICs is to remove the illumination pattern of the 70micron array. To do so, we ratioed different 70micron IC. The statistics (mean, std, median, mode, skewness, min, max) on the images provides the following:

ratio ICs PHOT(73DCEs)/SCAN(155DCEs): 1.409    4.949   1.05    1.08    22.93    0.001801    136.6
Side A alone: 1.035    0.1203    1.027    0.9834    0.03928    0.5763    1.353
Side B alone: 1.77    6.93    1.037    0.9892    16.3    0.001801    136.6

ratio ICs SCAN 77DCEs/77DCEs: 1.408    2.459    1.009    0.9553    15.46   0.02548    58.31
Side A alone: 1.005   0.08768    1.002    0.9989    0.1233      0.74    1.293
Side B alone: 1.858    3.525    1.141    0.9269    10.73   0.02548    58.31

ratio ICs PHOT 37DCEs/37DCEs: 1.688      3.43    1.021    0.9492    15.35    0.0723    78.69
Side A alone: 0.9994   0.06723    0.9956    0.9888   0.06672    0.7883    1.271
Side B alone: 2.489    4.927    1.401    1.185    10.71    0.0723    78.69


Some examples of the ratios of 70micron are shown in Figure3.


Figure3. Examples of ratios of 70micron Illumination Corrections: up-left: phot to scan, up-rigth: phot to phot (half of the DCEs to the other half), bottom-left: scan to scan (half of the DCEs to the other half). All images are shown with z1=-2 and z2=4.


Conclusions

We have constructed 70micron ICs (wide field) obtained in PHOTOMETRY and SCAN modes using two regions of the sky (zodi_14a and zodi_28b). The standard deviations of the 70micron ICs over the entire array are approximately 40%, but this statistics includes the illumination pattern of the 70micron array. If we remove the illumination pattern by ratioing two ICs, we find that the rms is approximately 9% in SCAN mode, 7% in PHOT.

Output and Deliverable Products

70micron IC to be used to reduce data obtained in Campaign X1.

Actions Following Analysis