Analysis
We obtained a 4 point dither map (1
cycle) at 24microns with 3 second DCEs in TWO REGIONS of
the sky chosen to avoid bright point sources. The offsets between
positions are 400 arcseconds. At each position of the dither pattern
there will be 16 images, so a total of 64 images were obtained
for each of the regions.
We used mips_sloper
turning off the row droop correction, with the Campaign D2 Dark Image,
then mips_caler with the 24micron latent correction turned off,
and finally mips_enhancer using the
same parameter file as in Campaing D1, except that we normalized the
input images before doing the median combine. We
basically used a 3sigma rejection and MEDIAN combining a total of
64DCEs for each of the two regions of the sky, and
a flatfield combining all 128DCEs.
The two regions of the sky observed were:
zodi_7c with a predicted brightness
at 24microns of 36MJy/strd, and
zodi_10a[85] with a predicted brightness
at 24microns of 36MJy/strd
OBSERVED average of the number of DN/s for 64DCEs for zodi_7c: 949+/-7 DN/s.
OBSERVED average of the number of DN/s for 64DCEs for zodi_10a[85]: 957+/-8 DN/s.
The similarity of the observed DN/s of the two regions is consistent with their predicted
24 micron brightnesses.
Results
The
24micron Flatfield observed in Campaign D2 by combining the 128DCEs obtained
observing two regions of the sky is shown in Figure1. Figure2
shows histograms of the DN/s of the normalized flatfields for the two regions of the
sky, and the combined 128DCE.
Statistics on the image provides the following:
24micron Flatfield - zodi_7c: Number
DCEs= 64; mean= 0.99409; median= 0.99999; sdtdev= 0.05345; skew=-0.30473
24micron Flatfield - zodi_10a[85]: Number
DCEs= 64; mean= 0.99336; median= 0.99999; sdtdev= 0.05374; skew=-0.33196
24micron Flatfield - COMBINED: Number
DCEs= 128; mean= 0.99403; median= 1.00000; sdtdev= 0.05359; skew=-0.31835
The statistics over the array however includes the effect of the illumination pattern of the
24micron array.
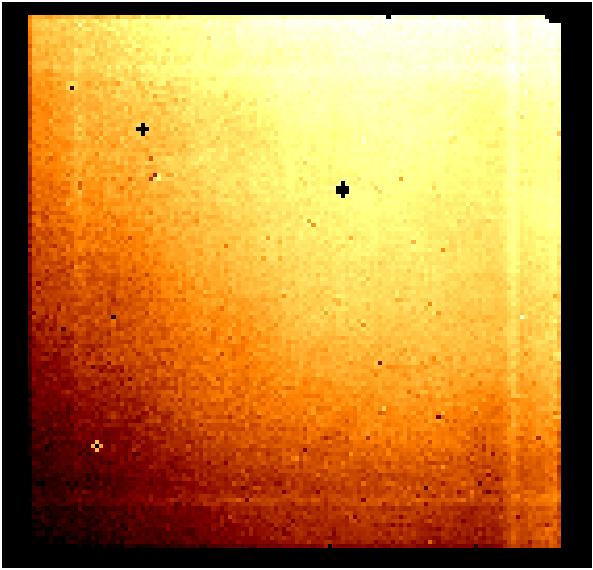
Figure1.
24Micron flat created with mips_enhancer displayed from z1=0.85 to
z2=1.1. For this flatfield we combined the observations of the two fields for a
total of 128DCEs.
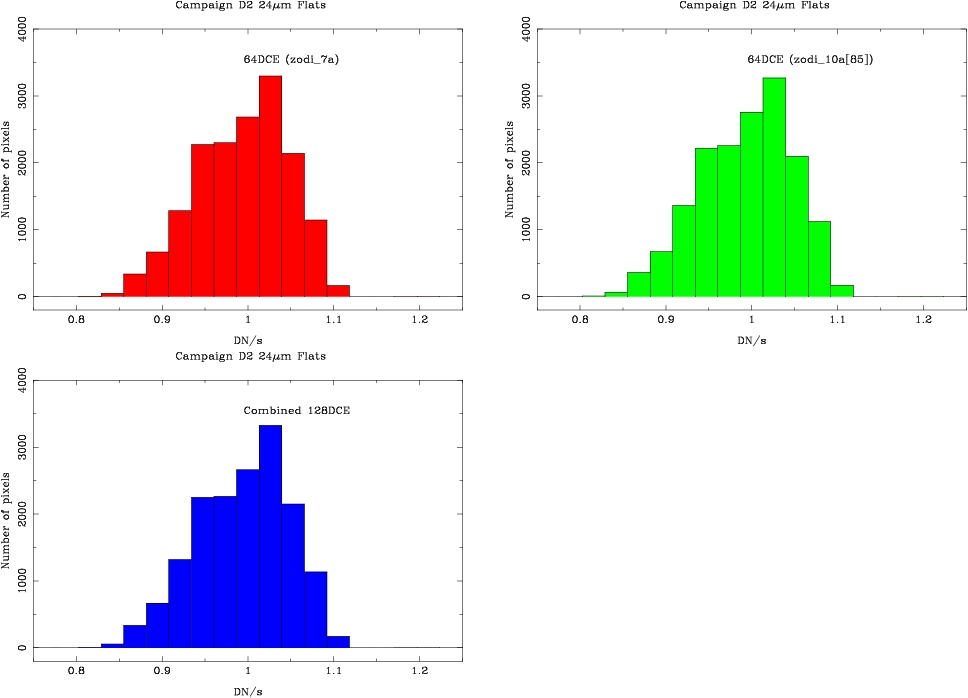
Figure2.
Histogram of the 24micron flatfields obtained in campaign D2.Two of them were made combining 64DCEs (for zodi_7c and zodi_10a[85]), and the third one
combining all 128DCEs.
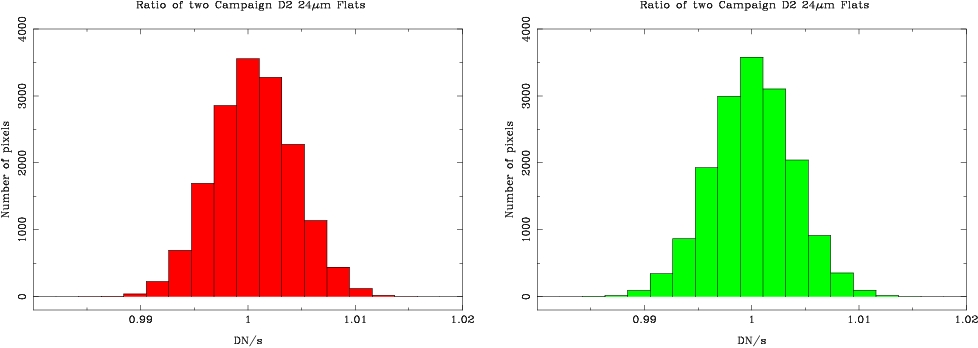
Figure3.
Histogram of the ratio of two flatfields produced using the first 8 DCEs of each
pointing (total 32DCES) and the last 8 DCEs of each pointing (total 32DCEs).Left panel is for zodi_7c and right panel is for zodi_10a[85].
A better way to assess the quality of the observed flatfiels is to remove the illumination
pattern of the 24micron array. To do so, we produced two different flatfields, the first one
using the first DCEs of each pointing, and the second one using the last 8DCEs of each pointing.
Then we divided the first flatfield (32DCEs) by the second flatfield (32DCEs).
We did this for the two different regions of the sky observed.
The resulting
ratio of two flatfields provides the following statistics for the two
observed regions of the sky:
Ratio of two 24micron Flats at zodi_7c:
mean= 1.00062; median= 1.00060; sdtdev= 0.00375; skew=-0.02250
Ratio of two 24micron Flats at zodi_10a[85]: mean= 1.00005; median= 1.00013; sdtdev= 0.00382; skew= 0.00641
and the histogram is shown in Figure3.
Another way to assess the quality of the observed flatfield is to do differential photometry
of stars observed on different positions on the array. We used 24micron Photometric Standard
Data (MIPS-920)
observations of the star HD159330. We used IRAF to perform photometry on
all the individual DCEs observed as part of MIPS-920. The photometry was
obtained through a number of different apertures with radii of 3, 5,
7, 9, 10, 13 pixels. The background was measured from an annulus with a radius
of 15pixels and a width of 5pixels. The results of the photometry as well
as the centroids (x and y) of the stars are presented in Table1.
The magnitudes are defined as:
mag = 25. - 2.5*log10(DN/s)
The measurement for the combined 30DCEs are given in the first part of Table1.
The number
of DN/s for a 5pixel radius aperture is: 68426DN/s and for a 7pixel aperture
is: 71087DN/s in good agreement with the independent measurement done by Chad Engelbracht
for a 6pixel radius aperture (see analysis of MIPS-920 in campaignD2).
The measuments in Table1 have been grouped according to neighboring positions of the
star on the array. For each of these groupings we have computed the average
magnitude observed through the five different apertures. This allows
a quick comparison of the measured magnitudes at different positions
on the array and comparison with the measurements for the combined 30DCEs.
From this comparison we find that the statistical quality of
the flatfield (for the few pointings done so far across the
array) is of the order of 1-2% for the small apertures, although the error increases slightly for
larger aperture (due to the larger uncertainties of the background estimate).
Table 1. 24 micron photometry of HD159330 as measured on
individual 24micron DCEs flatfielded
with Campaign D2 flat. The star data are from the MIPS-920
task (24 micron Flux Standard).
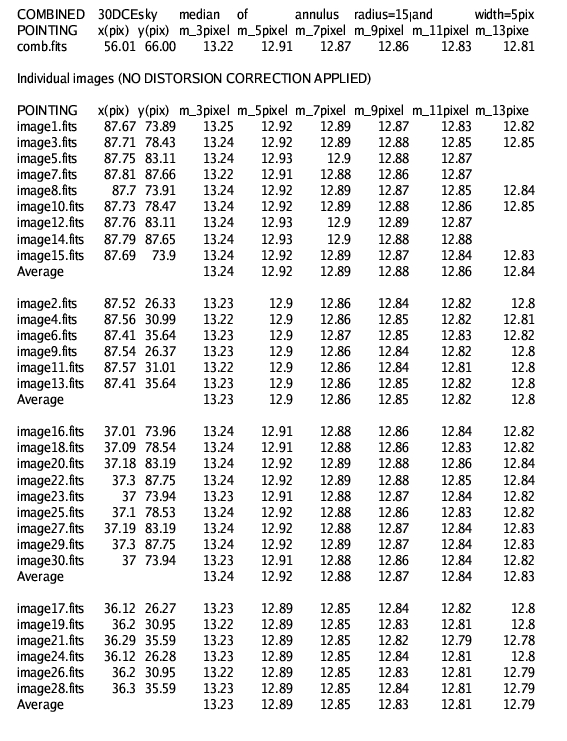
NOTES: The first column of the table indicates the DCE ordering
within the AOR file.
x(pix) and y(pix) are measured positions of the star, and m_3pix through
m_13pix are
magnitudes measured through the radius indicated in pixels.