Analysis
We obtained a 4 point dither map (1
cycle) at 24microns with 3 second DCEs in TWO REGIONS of
the sky chosen to avoid bright point sources. The offsets between
positions are 400 arcseconds. At each position of the dither pattern
there will be 16 images, so a total of 64 images were obtained
for each of the regions.
We used mips_sloper
turning off the row droop correction, with the Campaign E Dark Image,
then mips_caler with the 24micron latent correction turned off,
and finally mips_enhancer using the
same parameter file as in Campaing D1, except that we normalized the
input images before doing the median combine. We
basically used a 3sigma rejection and MEDIAN combining a total of
64DCEs for each of the two regions of the sky, and
a flatfield combining all 128DCEs. In addition we combined
all four 24micron flatfields observed in Campaigns D2 and E.
The two regions of the sky observed were:
zodi_11b with a predicted brightness
at 24microns of 31MJy/strd, and
zodi_10b with a predicted brightness
at 24microns of 44MJy/strd
OBSERVED average of the number of DN/s for 64DCEs for zodi_11b: 763+/-8 DN/s.
OBSERVED average of the number of DN/s for 64DCEs for zodi_10b: 1060+/-8 DN/s.
Results
The
24micron Flatfield constructed in Campaign E by combining the 128DCEs obtained
observing two regions of the sky is shown in Figure1. Statistics on the image provides the following:
24micron Flatfield - zodi_11b: Number
DCEs= 64;mean= 0.99465; median= 1.00000; sdtdev= 0.05079; skew=-0.35695
24micron Flatfield - zodi_10b: Number
DCEs= 64; mean= 0.99363; median= 1.00000; sdtdev= 0.05304; skew=-0.34726
24micron Flatfield - COMBINED (Campaign E): Number
DCEs= 128; mean= 0.99422; median= 1.00000; sdtdev= 0.05200; skew=-0.35146
24micron Flatfield - COMBINED (Campaign D+E): Number
DCEs= 256; mean= 0.99399; median= 0.99999; sdtdev= 0.05278; skew=-0.33503
The statistics over the array however includes the effect of the illumination pattern of the
24micron array. As can be seen the statistics does not improve significantly from combining
64DCEs to combining 256DCEs. In addition, we have concluded that at 24microns we will
have to construct flatfields for each of the observed scan mirror positions.
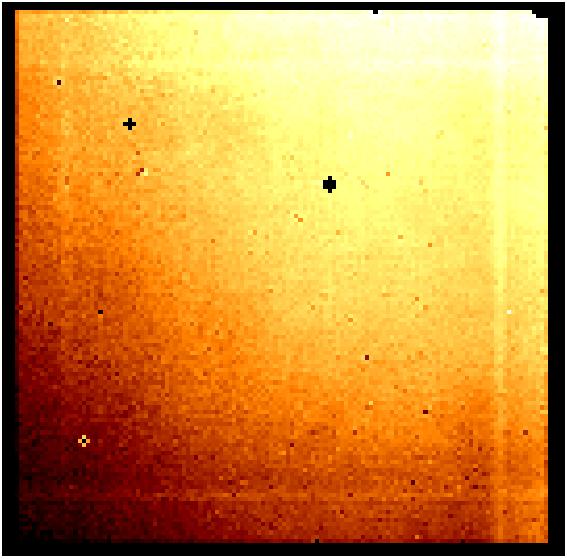
Figure1.
24Micron flat created with mips_enhancer displayed from z1=0.85 to
z2=1.1. For this flatfield we combined the observations of the two fields for a
total of 128DCEs.
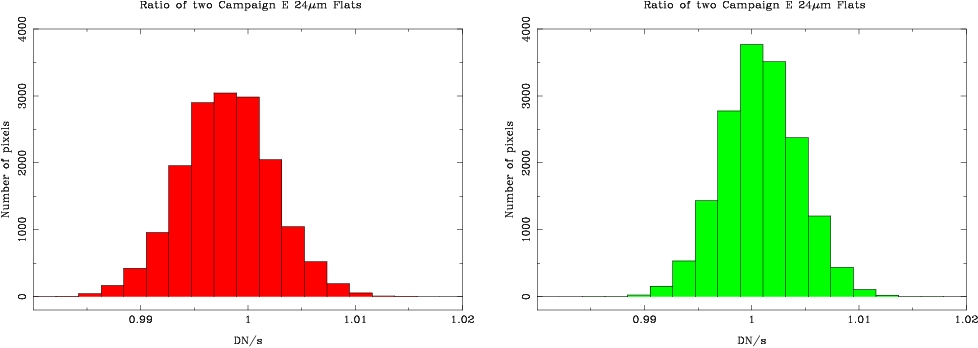
Figure2.
Histogram of the ratio of two flatfields produced using the first 8 DCEs of each
pointing (total 32DCES) and the last 8 DCEs of each pointing (total 32DCEs).Left panel is for zodi_11b and right panel is for zodi_10b.
A better way to assess the quality of the observed flatfiels is to remove the illumination
pattern of the 24micron array. To do so, we produced two different flatfields, the first one
using the first 8DCEs of each pointing, and the second one using the last 8DCEs of each pointing.
Then we divided the first flatfield (32DCEs) by the second flatfield (32DCEs).
We did this for the two different regions of the sky observed.
The resulting
ratio of two flatfields provides the following statistics for the two
observed regions of the sky:
Ratio of two 24micron Flats at zodi_11b: mean= 0.99805; median= 0.99800;
sdtdev= 0.00430; skew= 0.00663
Ratio of two 24micron Flats at zodi_10b: mean= 1.00081; median= 1.00079;
sdtdev= 0.00358 skew= 0.01762
and the histogram is shown in Figure2. The ratio of the zodi_11b flatfields shows
worse statistics because there is a bright star in the field of view.
Another way to assess the quality of the observed flatfield is to do differential photometry
of stars observed on different positions on the array. We used 24micron Photometric Standard
Data (MIPS-120)
observations of the star HD159330. We used IRAF to perform photometry on
the individual DCEs (30) of one of the pointings in MIPS-120. The photometry was
obtained through a number of different apertures with radii of 3, 5,
7, 9, 10, 13 pixels. The background was measured from an annulus with a radius
of 15pixels and a width of 5pixels.
The differential photometry obtained through the 5pixel radius aperture done in CampaignE is compared
in Figure3 with that done in Campaign D2 for the same standard star. The differential
photometry is done relative to the photometry on the combined 30DCEs of the standard star in
each of the campaigns. For clarity we also show in this figure the average of the centroid
measurements at each of the four positions where the star is placed when using the SMALL
FIELD PHOTOMETRY option. As can be seen from this figure, the star was not placed exactly
at the same positions in Campaign D2 and E. The aperture photometry was done on images
NOT CORRECTED FOR GEOMETRICAL DISTORTIONS. The results of the differential photometry
are consistent for the two campaigns. The dispersion of the photometry
done at different pointings is:
Campaign D2:
(88,80) stddev=0.006mag
(88,31) stddev=0.003mag
(37,80) stddev=0.005mag
(36,31) stddev=0.001mag
Campaign E:
(89,87) stddev=0.004mag
(89,38) stddev=0.002mag
(39,87) stddev=0.004mag
(39,38) stddev=0.01mag
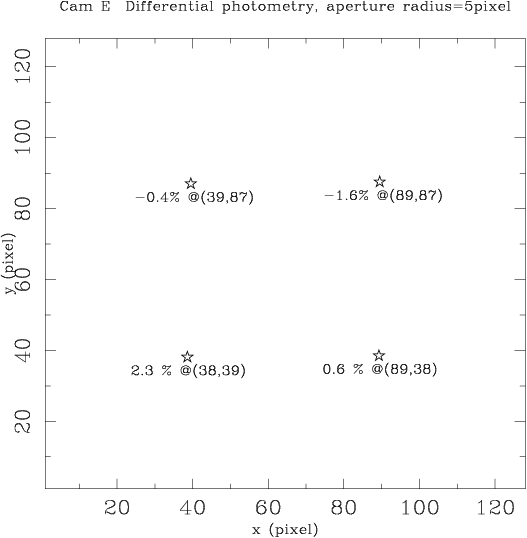
Figure3.
Comparison of the differential photometry BEFORE APPLYING THE DISTORTION CORRECTION
in Campaigns D (upper panel) and E (lower panel) for the
same star HD159330 through a 5pixel radius aperture. The differential photometry (given in percentage)
on individual DCD2 is done relative
to the photometry on the combined 30DCEs of the standard star observation of each of the campaigns.
We also give the average centroid positions of the star (different for each campaign).