There is a problem w/ your write-up. Check that you have valied entries
for \$CAID and \$Campn in your analysis.php file. If that checks out, then
Contact Stansberry";
return ;
}
// get first matching task
$row = mysql_fetch_array($result);
$title = $row["title"];
$princ = $row["principal"];
$deputy= $row["deputy"];
$campn0 = $row["campn0"];
$aorkeys = $row["aorkeys"];
// get real name of principal, deputies
$princ = ioc_get_person($princ);
$princ = $princ[0];
$deps = explode(",",$deputy);
foreach ($deps as $depty) {
$depty = trim($depty);
$depty = ioc_get_person($depty);
$depty = $depty[0];
$depty = explode(",",$depty);
$depty = $depty[0]; // last names only
$deplist[] = $depty;
}
$deplist = implode(", ", $deplist);
$caid = sprintf("%03d",$caid);
$file = "mips-".$caid.$campn.".analysis.php";
// if more matches, append the AORKEYS from those
$numrows = mysql_num_rows($result);
if ($numrows > 1) {
$aorkeys = " " . $numrows . " Task Executions: ". $aorkeys;
for ($i=0;$i < mysql_num_rows($result); $i++) {
$row = mysql_fetch_array($result);
$morekeys = $row["aorkeys"];
$aorkeys = $aorkeys .'; '.$morekeys;
}
}
// END PHP.
?>
<? echo "MIPS-$caid, Campaign $campn IOC/SV Analysis"; ?>
Principal:
Deputy:
Analyst:
AORKEYS:
Last Updated:
Task Outcome Summary
- DATA STATUS: Nominal
- TASK OUTCOME: Nominal
Abstract
This task takes IOC routine 24um PHOTOMETRY and SCAN mode flatfields (and is repeated a number of times in different IOC campaigns) to be used on a regular basis. This report combines the 24 um tasks MIPS-914 and MIPS-917 as the data are analyzed simultaneously. The pair of activities will allow us to determine the relative efficiency and quality of flatfields created using scan and photometry AORs. Since this task is repeated a number of times during IOC, we will observe different regions of the sky each time. The task will check for possible variations of quality of flatfield or saturation. These tasks will also be useful for screening regions of the sky to obtain flatfields in SIRTF routine operations. These tasks (MIPS-914 and MIPS-917) will determine whether routine flatfields will be obtained in photometry or scan mode. The photometric accuracy of standard star HD159330 varies by <2% as a function of array position, and flat fields constructed from either PHOTOMETRY or SCAN-MAP mode yield essentially no change in source photometric accuracy. Using flatfields specific to the scan-mirror position angle of each DCE greatly improves the aesthetic image quality and removes most obvious artifacts. Therefore, the optimal data reduction will include flat fields at each scan mirror position angle, which requires flat fields constructed in both PHOTOMETRY and SCAN-MIRROR position angle.
Analysis
In PHOTOMETRY mode, we obtained 4 point dither maps (1 cycle) at 24 um with 3 second DCEs in regions of sky chosen to avoid bright point sources. The offsets between positions are 400 arcseconds. At each position of the dither pattern there will be 16 images, so a total of 64 images were obtained for each of the regions. The data analyzed here use the photometry modes from campaigns EFGHI, with a total of 10 sky regions, producing a total of 560 DCEs.
In SCAN mode, we obtained 2-degree long (per leg) scan maps at 24 um using the 'fast-scan' mode in regions of sky chosen to avoid bright point sources. The scan map produced 166 DCEs in one AOR from campaign I (~14.5 minutes of integration) and 100 DCEs in each of two AORs in campaign J (~17.5 minutes of integration). The combined scan maps contain a total 432 DCEs.
All images were processed in the same fashion.
We used mips_sloper turning off the row droop correction, with the Dark Images from the appropriate campaigns, then we used mips_caler with the 24micron latent correction and flat-field calibration turned off, and finally mips_enhancer using the same parameter file as in Campaing D1, except that we normalized the input images before doing the median combine. We basically used a 3sigma rejection and MEDIAN combining to construct flatfields.
We constructed a total flat field using all the images combined from both PHOTOMETRY and SCAN map mode at 24um from Campaigns EFGHIJ. The resulting flat field combines 992 DCEs from 10 sky regions spanning Zodi brightnesses from ~ 30 - 51 MJyr/sr (see table below). The AORs, campaign, and sky brightness values are listed in table 1. We also constructed total flat fields using the data only from PHOTOMETRY and SCAN MAP, using 560 and 432 total DCEs, respectively.
Table 1. AORKEYs and sky brightness values for flat-field images.
| Campaign |
Region |
Zodi Brightness at 24 um [MJy/sr] |
AORKEY
|
| PHOTOMETRY MODE |
| E | zodi_11b | 44 | 6770176 |
| E | zodi_10b | 31 | 6770432 |
| F | zodi_11a | 30 | 6941440 |
| F | zodi_11c | 31 | 6945536 |
| F | zodi_27a | 45 | 6942976 |
| F | zodi_27b | 42 | 6943232 |
| G | zodi_12a | 51 | 6936832 |
| H | zodi_12b | 49 | 7141632 |
| H | zodi_28a | 42 | 7141888 |
| I | zodi_12a | 45 | 7164928 |
| SCAN MODE |
| I | zodi_13a | 51 | 7164160 |
| J | zodi_13a | 51 | 7638528 |
Results
Comparison of Flatfields from PHOTOMETRY and SCAN-MAP MODE data.
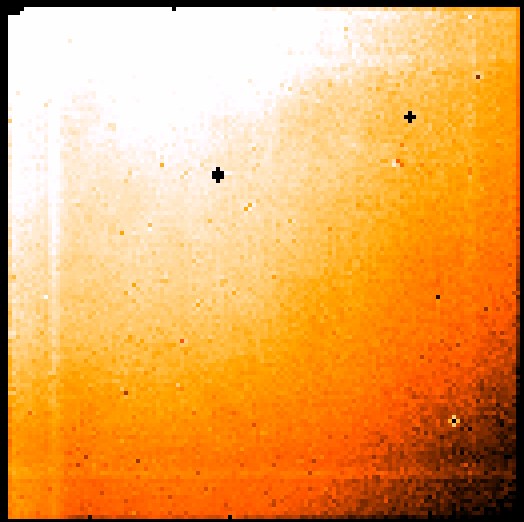
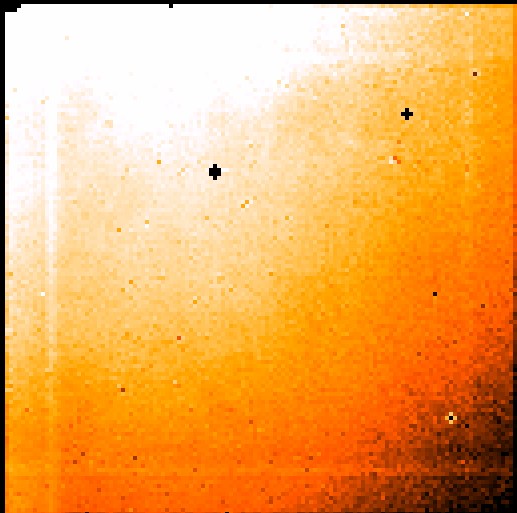
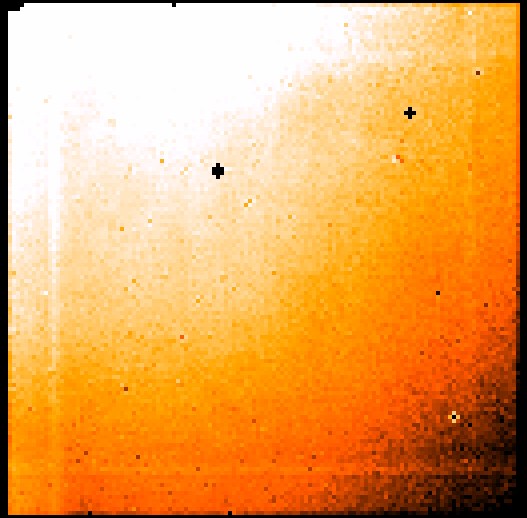
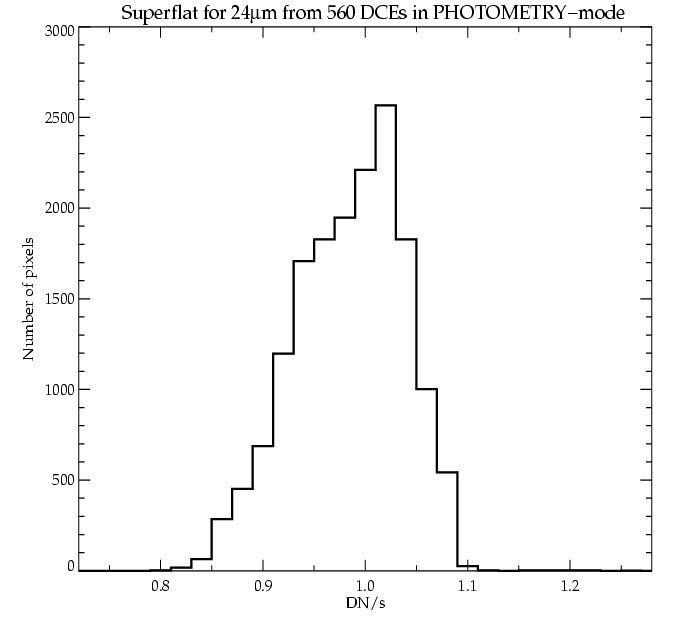
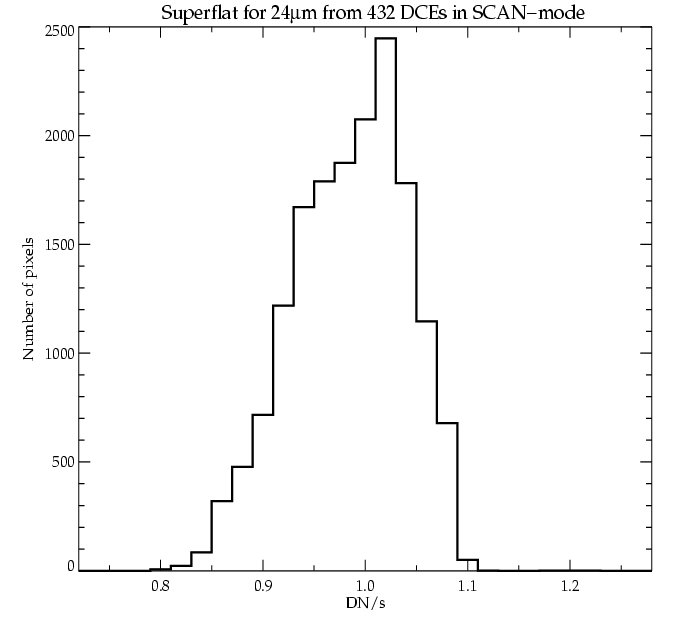
The combined 24 um flatfields using the separate and combined PHOTOMETRY and SCAN-MAP data from Campaigns EFGHIJ is shown in Figure 1. Figure2 shows the corresponding histograms of the DN/s for the three flatfields. Statistics from the images are listed in table 2.
Figure1. 24 um flats created with mips_enhancer displayed from z1=0.8 to z2=1.2. LEFT Total combined flatfield from both PHOTOMETRY and SCAN-MAP mode data from Campaigns EFGHIJ. CENTER Total flatfield using all PHOTOMETRY-mode data from Campaigns EFGHI. RIGHT Total flatfield using all SCAN-map mode data from Campaigns IJ.
Table 2. Statistics of 24 um Flatfields.
| Flatfield Observing Mode |
Number of DCEs |
Mean |
Median
| Mode
| Std Dev.
| Skew
|
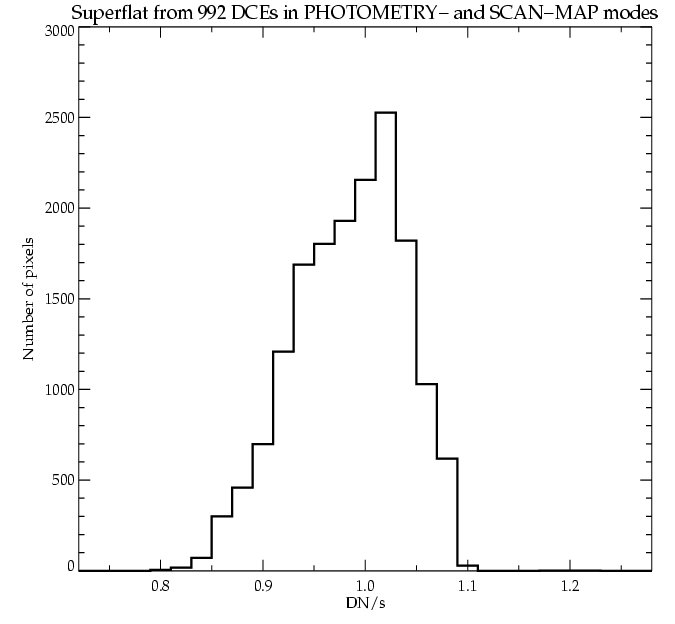
| PHOTOMETRY and SCAN-MAP | 992 | 0.9945 | 1.0000 | 1.011 | 0.0535 | -0.3477 |
| PHOTOMETRY | 560 | 0.9943 | 1.0000 | 1.011 | 0.0531 | -0.2781 |
| SCAN-MAP | 432 | 0.9947 | 1.0000 | 1.011 | 0.0549 | -0.3352 |
Figure2. Histograms of 24 um super flatfields flat produced from campaigns EFGHIJ. LEFT Total combined flatfield from both PHOTOMETRY and SCAN-MAP mode data from Campaigns EFGHIJ. CENTER Total flatfield using all PHOTOMETRY-mode data from Campaigns EFGHI. RIGHT Total flatfield using all SCAN-map mode data from Campaigns IJ.
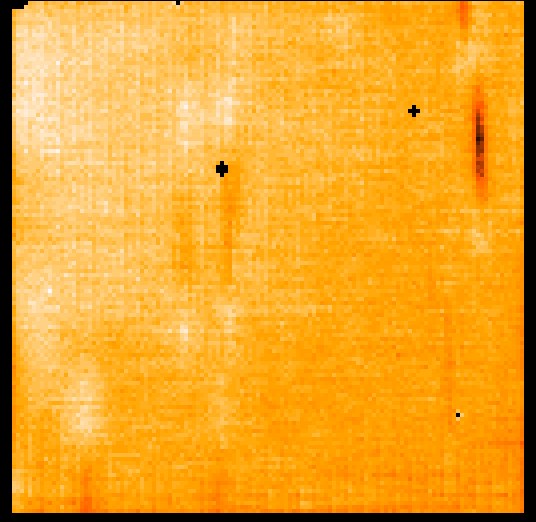
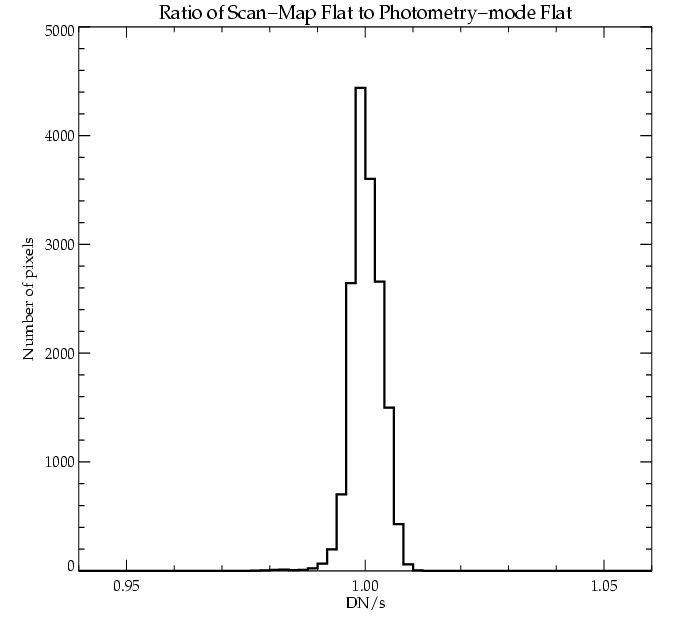
In figure 3, we show the ratio of the total flat field constructed using data from the SCAN-MAP mode to the total flat field constructed using data from PHOTOMETRY mode, and histrogram of pixel values in the ratio. The residuals seen in the ratio are quite low-level: the standard deviation in the ratio is 0.0031, which is comparable to the number-counting uncertainties. Improving rms requires an order of magnitude increase in the number of images over the ~500 used here for both the PHOTOMETRY and SCAN-MAP flat fields. Therefore, the PHOTOMETRY and SCAN-MAP flatfields are consistent with each other at the ~0.3% level. However, to remove the flatfield residuals from image reductions, we need to use flat fields derived for each scan-mirror position (see below). Therefore, this advocates constructing flat fields using both PHOTOMETRY and SCAN-MAP modes, and using the appropriate flatfield for each scan-mirror position angle.
Figure3. Left Ratio of the super flatfield constructed from the scan-map data from campaigns IJ to the super flatfield constructed from the photometry data from campaigns EFGHI. The stretch extends from 0.9 to 1.1. RIGHT Histogram of pixel values in the ratio shown in the left panel. The histogram has a mean of 1.000 and standard deviation of 0.0031.
Dependency of Flatfield with Scan-Mirror Position
As reported in the analysis of tasks MIPS 917 for previous campaigns, there are artifacts in the flat fields that vary in array position as a function of the MIPS scan-mirror position. We have therefore constructed MIPS 24 um flat fields as a function of scan mirror position. For each DCE, the predicted scan mirror position has a value recored in the image headers under the keyword 'CSM_PRED'. Note that the header records only the 'predicted' scan mirror position, and there may be no way to reconstruct the precise scan mirror angle. Slight variations in scan mirro angle are possible.
We constructed scan-mirror-dependent flatfields using the scripts written by K. Misselt (in MakeFlat.pro). Briefly, these scripts read in a list of AORs, and constructs new multi-extention FITS images that contain all DCEs with the same CSM_PRED value. These scripts then apply mips_sloper, mips_caler, and mips_enhancer with the appropriate values (see above) to construct flat fields at each CSM_PRED value. Using this script we constructed scan-mirror dependent flat fields using both the PHOTOMETRY and SCAN-MAP mode data (which are taken with different CSM_PRED values).
In figure 4, we show the 24 um flat fields from the total PHOTOMETRY (averaged over all CSM_PRED values), and three example flat fields from data with the same Scan Mirror position (with CSM_PRED values 1854.50, 1929.00, and 2149.50). Note the image 'artifacts' (or image 'crud') that moves in the y-direction as a function of scan-mirror position (indicated by the red circle in the figure). Low-level features are highly visible in the scan-mirror depenedent flat fields. This is illustrated in figure 5, which shows the ratio of flat fields for data with CSM_PRED values of 1864.50 to data with CSM_PRED value of 2149.50. The 'bright' and 'dark' regions that appear as ying and yang opposites show the flat-field dependent 'crud'.
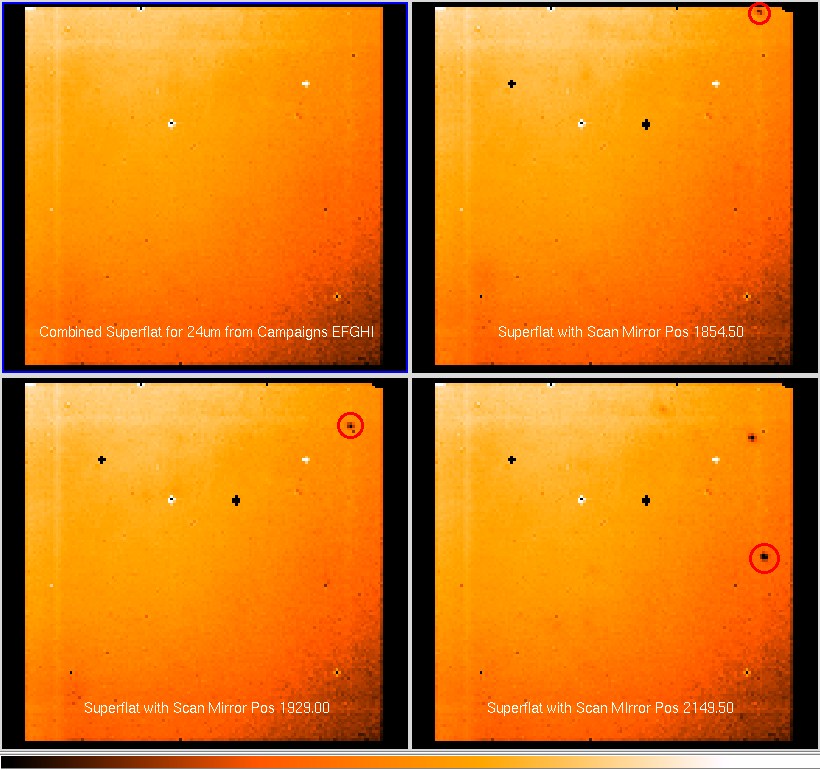
Figure 4. Super-flatfield images at 24 um constructed as a function of scan mirror position (recorded in the CSM_PRED header keyword value). TOP LEFT Total flatfield image using all DCEs from campaigns EFGHI in PHOTOMETRY mode averaged over all CSM_PRED values. TOP RIGHT Flatfield image using all DCEs with scan-mirror position 1854.50. BOTTOM LEFT Flatfield image using all DCEs with scan-mirror position 1929.00. BOTTOM RIGHT Flatfield image using all DCEs with scan-mirror posotion 2149.50. Note the flatfield image 'crud' that moves in the y-direction with changes in the scan-mirror angle, one such image artifact is indicated by the red circle in each image.

Figure 5. Ratio of flatfield image at 24 um with scan-mirror position 1864.50 to flatfield image with scan-mirror position 2149.50. The 'ying' and 'yang' (bright and dark features) show the image artifacts that vary as function of scan-mirror angle.
We have reanalyzed MIPS 24 um observations of the standard star HD159330 (from task mips-920) using the scan-mirror dependent flatfield. Figure 6 shows observations of HD159330 at scan-rmirror position 2106.5 and reduced using both the total flatfield (with no scan-mirror dependency) and using the scan-mirror dependent flatfield. Using the scan-mirror dependent flat field appears to remove all visible image artifacts.
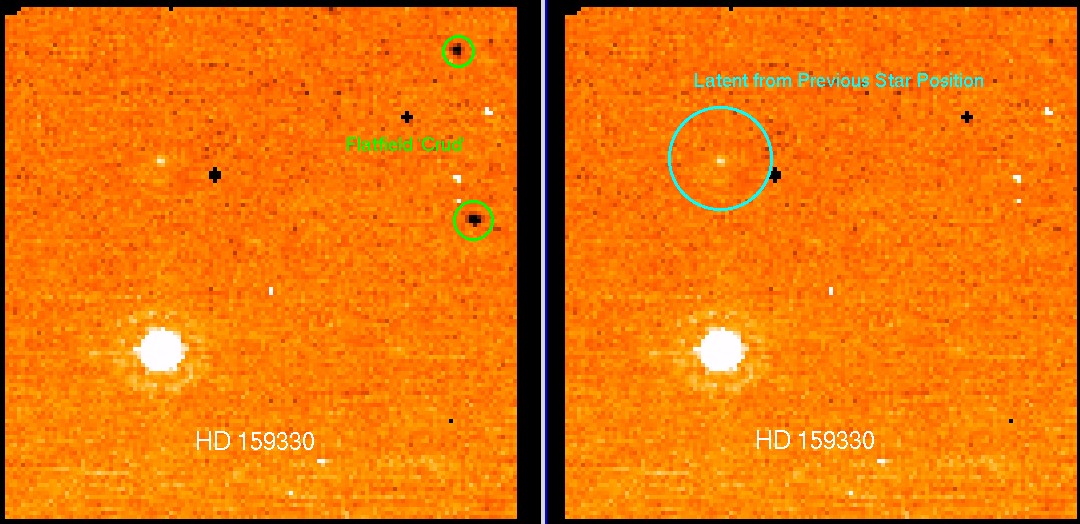
Figure 6. MIPS 24 um observations of the standard star HD159330 with scan-mirror position 2106.50 reduced using the total flatfield with no scan-mirror dependency ( LEFT ) and using the scan-mirror dependent flatfield for this scan-mirror position angle ( RIGHT ). Note the image 'crud' in the left-panel that is removed using the appropriate scan-mirror flatfield (denoted by green circles). The cyan circle indicates the latent image from the position of HD159330 in a previous DCE.
Relative Photometric Accuracy as a Function of Array Position
We reanalyzed the MIPS 24 um observations of the standard star HD 159330 (taken from MIPS task 920) from all campaigns EFGHIJ using both the total flat field from data taken in PHOTOMETRY mode and the flatfields constructed with data at each scan-mirror position angle.
We used IRAF to perform photometry on all the individual DCEs for HD 159330 observed as part of MIPS-920 (a total of 240 separate DCEs). The photometry was obtained through a number an apertures with radii of 6 pixel (past the first Airy disk). The background was measured from an annulus with a radius of 10 pixels and a width of 3 pixels.
From the 240 DCEs for HD 159330 reduced with the total PHOTOMETRY flatfield, the mean and std dev of the flux at 24 um are: mean=68614.3 DN/s; stddev= 1232.4 DN/s. Similarily, using the flatfields for each individual position angle, the mean and std dev of the 24 um flux are: mean= 68147.2 DN/s; STDDEV= 1279.2 DN/s. The mean photometry is consistent well within the stddev of the photometry. Note the increase in the scatter of photometry when using the individual flat fields in the reduction of each observation. This is likely due to the lower number of DCEs used to construct the flat field at each scan mirror position (e.g., there are 7 scan-mirror position angles in PHOTOMETRY mode, 6 of the positions have 70 DCEs per flatfield, while one has 140; cf. the 560 DCEs used to construct the total flat).
To check photometric accuracy as a function of array position (see for example, the analysis of mips-917 for campaign f), Figure 7 plots the measured photometry as a function of the y-pixel coordinate of the centroid of the standard star HD 159330 for data reduced using the total PHOTOMETRY-mode flat field, and using the scan-mirror-dependent flat field. Note that there seems to be little variation in photometry with x-pixel coordinate. The slight gradient seen in the photometry with y-pixel see in previous analyses persists here in both the data-reductions. The gradient is essentially the same for each the reductions using each flatfield. The change is roughly delta[ log(DN/s) ] / delta(y) = -0.00027 using the total PHOTOMETRY mode flatfield, which mutliplied by 128 pixels corresponds to a change of 0.035 dex in DN/s over the whole array. The change is roughly delta[ log(DN/s) ] / delta(y) = -0.00028 using the total scan-mirror dependent flatfields, which mutliplied by 128 pixels corresponds to a change of 0.035 dex in DN/s over the whole array. Therefore, using the scan-mirror dependent flat fields does not greatly affect the resulting source photometry.
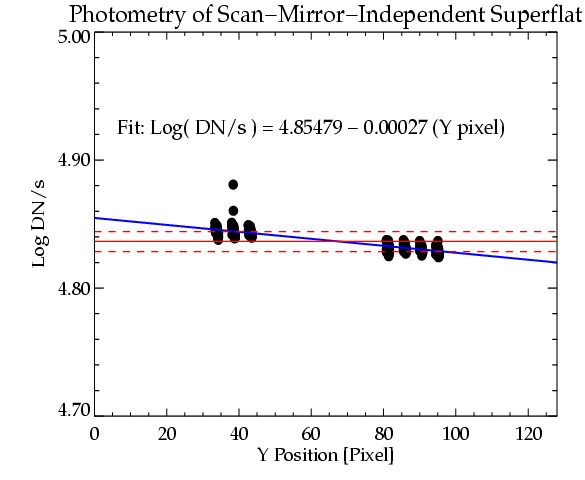
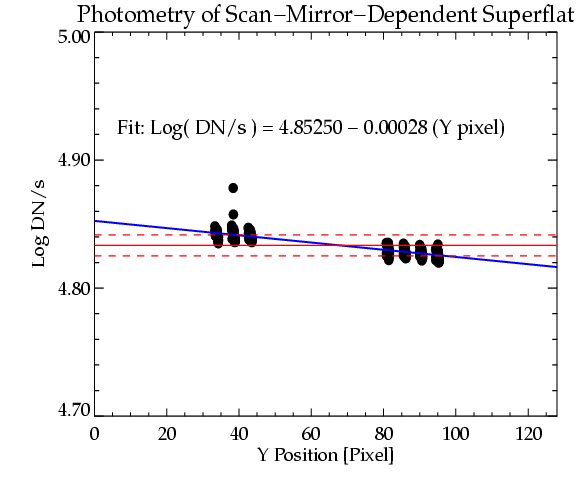
Figure7.Photometry of the standard HD159330 as a function of y-pixel coordinate on the 24um array. The red solid line indicates the mean flux (in log DN/s) and the dashed lines show the 1 sigma standard deviation in both figures. The solid blue line shows the linear-regression fit to the data points with fit in the plot inset. LEFT Data reduction using total PHOTOMETRY-mode flatfields. RIGHT Data reduction using flatfield derived for each scan-mirror position angle.
Dependency of Flatfield on Sky Brightness
Lastly, we have studied the dependence of the 24 um flatfield on the background brightness. We constructed two flatfields using the data from Campaigns EFGHI taken in PHOTOMETRY mode at different brightness letter. The first flatfield (HIGH BACKGROUND) uses the data from sky regions with the five brightest fields, and the second flatfield (LOW BACKGROUND) uses the data from sky regions with the five faintest fields. The mean sky brightnesses and rms of the backgrounds used for each flatfield are 46.8 +/- 3.0 MJy/sr and 35.0 +/- 6.4 MJy/sr for the HIGH and LOW BACKGROUND flatfields, respectively. I.e., the mean brightness varies by ~ 33%. (See also the sky brightnesses in table 1.) Note however, that this test uses the predicted 24 um sky brightnesses, and may vary from what is actually observed on the sky.
In figure 8, we show the HIGH and LOW background flatfields, and the ratio of the two (ratio of HIGH to LOW). Figure 9, shows the histrogram of pixel values fro the ratio of the HIGH and LOW background flatfields. We observe essentially no difference between the two down to the sub-percent level. There appears to be a slight image gradient across image rows (from left to right in the figure), such that the ratio value varies by ~ 0.3% across the face of the image. However, the rms of the mean of 280 DCEs is expected to be approximately sqrt(280)/279. = 0.6%, so the current data are consistent with low-number statistics at this level. An order of magnitude increase in the number of DCEs is required to improve these results. Therefore, based on the data thus far, the 24 um flatfields show essentially no dependence (to < 0.6%) on background illumination level, for background regions with brightnesses in the range used here.
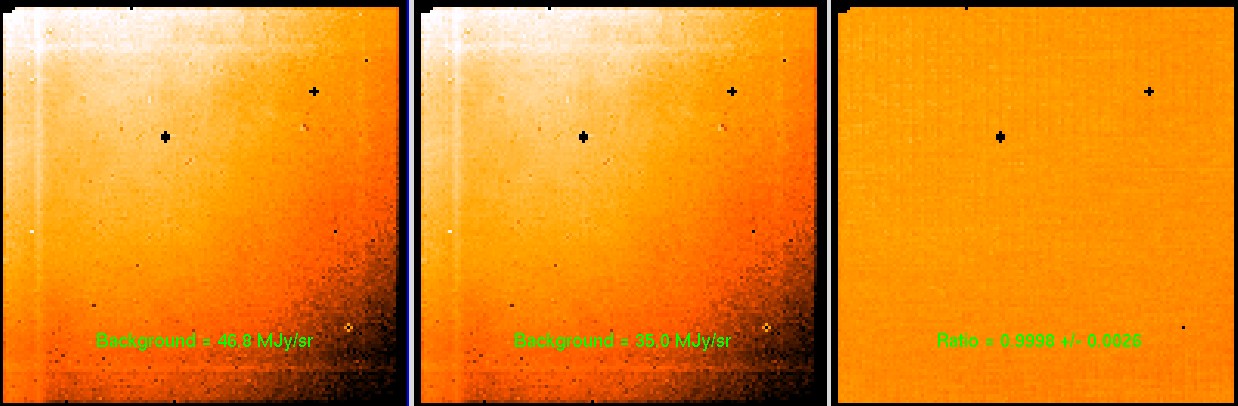
Figure 8. MIPS 24 um flatfields as a function of background brightness. Left Flatfield constructed from PHOTOMETRY mode data on the five brightest sky regions (HIGH background; see table 1) with a stretch from 0.8 to 1.2. Center Flatfield constructed from PHOTOMETRY mode data on the five faintest sky regions (LOW background), with the same stretch as the left panel. Right ratio of the flat fields (ratio of HIGH to LOW background flatfields) with a stretch from 0.95 to 1.05. The mean and standard deviation of the ratio image are 0.9998 and 0.0026, respectively. The mean background brightnesses (in MJy/sr) are shown inset in each panel.
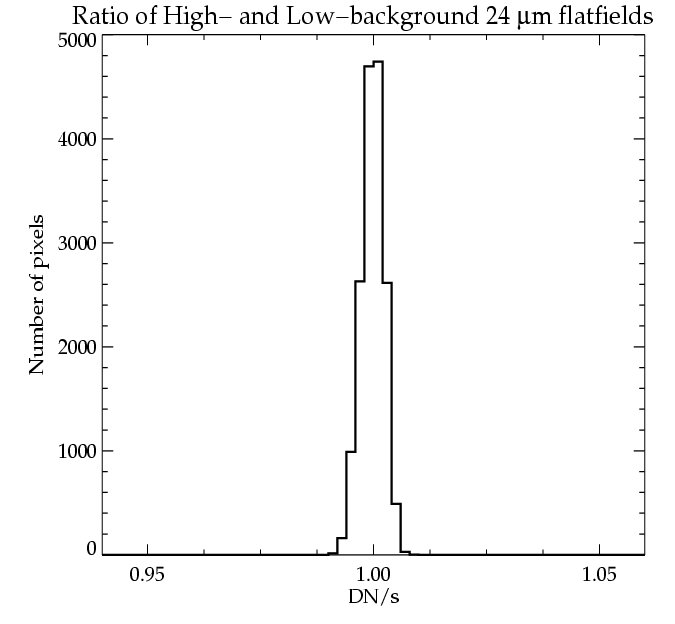
Figure 9. Histogram of the ratio of 24um flatfields constructed from the HIGH to LOW sky backgrounds. The histogram has a mean of 0.9998 and width of 0.0024.
Conclusions
We have constructed MIPS 24 um flatfields obtained in both PHOTOMETRY and SCAN map modes using data from campains EFGHIJ (992 total DCEs) from ten different regions of the sky. We have constructed both individual flatfields from data taken in each mode using 560 DCEs in PHOTOMETRTY mode and the 432 in SCAN-map mode, as well as a total superflat. The standard deviation of the 24 um Flatfield over the entire array is approximately 5%, but this statistics includes the illumination pattern of the 24 um array (see Analysis writeup of Flat Fields mips-917 for Campaign D2). Comparing photometry of the standard star HD 159330 at various positions across the array, we find that the photometry varies by less than 2.0 percent. Further analysis of the HD159330 observations using data reduced with scan-mirror-dependent flat fields shows no improvement in the photometric accuracy over that using the total flat field, but does effectively remove all flatfielding artifacts, greatly improving the image aesthetics. Furthermore, we find no variation in flatfield as a function of sky background brightness (for sky brightnesses in the range of ~ 30-50 Myr/sr). Variation in photometry persists at the 2.0% level along the y-pixel coordinate values, which probably corresponds to known problems from the 2nd-read in the onboard 24 um processing.
Output and Deliverable Products
MIPS 24 um Flatfields to be used to reduce data obtained in subsequent campaigns.
Actions Following Analysis