There is a problem w/ your write-up. Check that you have valied entries for \$CAID and \$Campn in your analysis.php file. If that checks out, then Contact Stansberry"; return ; } // get first matching task $row = mysql_fetch_array($result); $title = $row["title"]; $princ = $row["principal"]; $deputy= $row["deputy"]; $campn0 = $row["campn0"]; $aorkeys = $row["aorkeys"]; // get real name of principal, deputies $princ = ioc_get_person($princ); $princ = $princ[0]; $deps = explode(",",$deputy); foreach ($deps as $depty) { $depty = trim($depty); $depty = ioc_get_person($depty); $depty = $depty[0]; $depty = explode(",",$depty); $depty = $depty[0]; // last names only $deplist[] = $depty; } $deplist = implode(", ", $deplist); $caid = sprintf("%03d",$caid); $file = "mips-".$caid.$campn.".analysis.php"; // if more matches, append the AORKEYS from those $numrows = mysql_num_rows($result); if ($numrows > 1) { $aorkeys = " " . $numrows . " Task Executions:  ". $aorkeys; for ($i=0;$i < mysql_num_rows($result); $i++) { $row = mysql_fetch_array($result); $morekeys = $row["aorkeys"]; $aorkeys = $aorkeys .';  '.$morekeys; } } // END PHP. ?> <? echo "MIPS-$caid, Campaign $campn IOC/SV Analysis"; ?>

Principal:
Deputy:
Analyst:
AORKEYS:
Last Updated:


Task Outcome Summary


Abstract

We have constructed the first 70micron (wide field) IC obtained in PHOTOMETRY mode using one region of the sky (zodi_12a), that is, a total of 108DCEs. The standard deviation of the 70micron IC over the entire array is approximately 37%, but this statistics includes the illumination pattern of the 70micron array. If we remove the illumination pattern by ratioing two IC, one constructed using the first 54DCEs and the second one using the last 54DCEs then we find that the rms is approximately 6%.

Analysis

We obtained a 9 point dither map (1 cycle) at 70microns with 3 second DCEs of a region of the sky chosen to avoid bright point sources. The offsets between positions are 300 arcseconds. At each position of the dither pattern there are 16 images (4 of which are stim flashes), so a total of 108 sky images were obtained to construct the 70micron Illumination Correction (IC). This activity is a companion to the 70 um routine SCAN IC task (MIPS-915). The pair of activities will allow us to determine the relative efficiency and quality of ICs created using scan and photometry AORs. Since this task is repeated a number of times during IOC, we will observe different regions of the sky each time. The task will check for possible variations of quality of IC or saturation. This task will also be useful for screening regions of the sky to obtain ICs in SIRTF routine operations. This task together with MIPS-915 will determine whether routine ICs will be obtained in photometry or scan mode.

We used mips_sloper turning off the electronic non-linearity correction, mips_caler (using the 70micron dark me_70_darka_CamG_10oct2003.fits) and mips_enhancer with the following options:

mips_enhancer -SK -i listof70flats.txt -o me_70_ic_CamG_10oct2003 -C -dn

The region of the sky observed was:

zodi_12a (RA=7:3:28.1676 and Dec=27:40:3.6547, J2000) with a predicted brightness at 70microns of 15.7MJy/sr,

We also use the preliminary conversion factor between DN/s and Jy at 70micron (0.64DN/s/Jy relative to the stim flash) derived by Eiichi Egami to infer an observed flux for this region of:

OBSERVED average of the number of DN/s for 108DCEs for zodi_12a: 0.034+/-0.005DN/s (relative to the stim) or 23MJy/sr.


Results

The 70micron IC constructed using 108DCEs observed in Campaign G is shown in Figure1. Statistics on the image provides the following:

zodi_12a: mean= 1.00; median= 0.92985; sdtdev= 0.36608; skew= 2.37739


Figure1. 70micron Illumination Correction created with mips_enhancer displayed from z1=0. to z2=2. For this IC we combined the observations of one region of the sky for a total of 108DCEs.
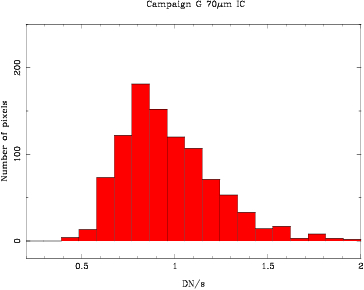


Figure2. Histogram of the 70micron Illumination Correction (108DCEs).
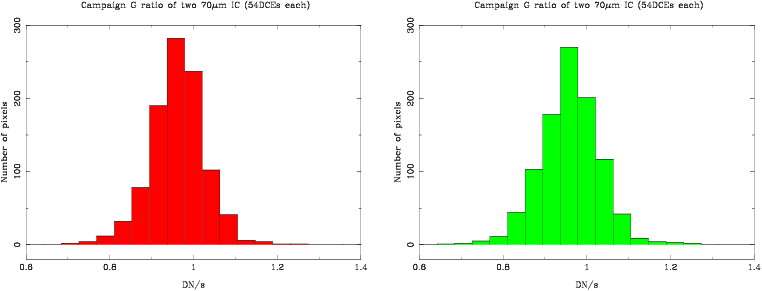


Figure2. Ratios of two 70micron Illumination Corrections (each of them is the combination of 54DCEs) constructed with the region of the sky observed in campaign G. The right panel shows the ratio of ICs constructed using mean combine and the left shows the ratio of ICs constructed using median combine.


A better way to assess the quality of the observed flatfiels is to remove the illumination pattern of the 70micron array. To do so, we produced two different IC, the first one using the first 54DCEs and the second one using the last 54DCEs. The resulting ratio of two ICs provides the following statistics, using median combine and mean combine:

ratio of two 70micron IC (median combine): mean= 0.96142; median= 0.96290; sdtdev= 0.06463; skew=-0.14719
ratio of two 70micron IC (mean combine): mean= 0.95970 median= 0.96095 sdtdev= 0.07109 skew=-0.01938


The histograms of the two 70micron ICs are shown in Figure3. The statistics on the ratio of two 70micron IC give 6%rms over the array.

Conclusions

We have constructed an 70micron IC (wide field) obtained in PHOTOMETRY mode using one region of the sky (zodi_12a), that is, a total of 108DCEs. The standard deviation of the 70micron IC over the entire array is approximately 37%, but this statistics includes the illumination pattern of the 70micron array. If we remove the illumination pattern by ratioing two IC, one constructed using the first 54DCEs and the second one using the last 54DCEs then we find that the rms is approximately 6%.

Output and Deliverable Products

70micron IC to be used to reduce data obtained in campaign G.

Actions Following Analysis