Analysis
In PHOTOMETRY mode we obtained a 9 point dither map (1
cycle) at 70microns with 3 second DCEs of two regions of
the sky (zodi_12a and zodi_12b) chosen to avoid bright point sources.
The offsets between positions are 300 arcseconds. At each position of the dither pattern
there are 16 images (4 of which are stim flashes), so a total of 108
sky images times two fields (216 images) were obtained to construct the
70micron Illumination Correction (IC).
In SCAN mode we have observed 2 degrees (1 leg) in fast mode for three different regions of
the sky (zodi_13a, zodi_13b, and zodi28b). Note that two of
the 70micron SCAN regions were observed in MIPS-914 and MIPS-916.
Since these tasks are repeated a number of times during IOC, we will observe
different regions of the sky each time. The tasks will check for possible
variations of quality of IC or saturation. This task will also be useful for
screening regions of the sky to obtain ICs in SIRTF routine operations.
The reduction was performed with the DAT programs. We used mips_sloper with
sensitive cosmic ray detection (-q option)
turning off the electronic non-linearity correction, mips_caler (using
the 70micron me_70_darka_CamO_1_2nov2003.fits)
and mips_enhancer with the following options:
verbose = 0
scale = 1.
filename = ic70_scan
prefix = ic_scan70
nXTile = 1
nYTile = 1
dark = 0
flat = 0
illumination_correction = 1
NormalizeInput = 1
SigmaCut = 3.0
SigmaTolerance = 0.25
MaxIterations = 10
StackSTDEV = 0
OutlierMinPoints = 3
QuartileFactor = 10
OverlapTolerance = 0.5
diagonistics = 1
WriteGeometry = 0
WriteOutlier = 0
WriteTiles = 0
FluxMean = 0
FluxMedian = 1
OverWrite = 1
distortion = 0
UseBoostFrame = 1
reject = 1
Note that we rejected the first DCE after the stim flash (reject = 1 option) and normalized
the input images (NormalizeInput = 1 option).
The regions of the sky observed were:
zodi_12a (RA=07:03:28.1676 and Dec=+27:40:03.6547, J2000) with a predicted brightness
at 70microns of 11.8 MJy/sr,
zodi_12b (RA=07:37:31.5146 and Dec=+27:35:20.6376, J2000) with a predicted brightness
at 70microns of 12.3 MJy/sr,
zodi_13a (RA=07:03:28.1676 and Dec=+27:40:03.6574, J2000) with a predicted brightness
at 70microns of 13.5 MJy/sr,
zodi_13b (RA=21:05:07.4259 and Dec=-21:54:04.3864, J2000) with a predicted brightness
at 70microns of 14.5 MJy/sr.
zodi_28b (RA=21:32:18.5321 and Dec=-19:52:22.7257, J2000) with a predicted brightness
at 70microns of 14.1 MJy/sr,
The predicted values of the 70micron brightness are from SPOT for the date of th
e observing (Nov 1, 2003).
Results
The PHOTOMETRY and SCAN mode 70micron ICs constructed using 108DCEs
and 460DCEs respectively observed in Campaign O are shown in Figure1.
Statistics on the images provides the following:
PHOT two reg (216DCEs): mean= 0.91011; median= 0.88395; sdtdev= 0.28360; skew= 0.01695;
PHOT zodi12a (108DCEs): mean= 0.90119; median= 0.87282; sdtdev= 0.28303; skew= 0.31205;
PHOT zodi12b (108DCEs): mean= 0.92674; median= 0.89365; sdtdev= 0.27983; skew= 0.26047;
SCAN three reg (480DCEs): mean= 0.98005; median= 0.95400; sdtdev= 0.24375; skew= 0.02545;
SCAN zodi13a (160DCEs): mean= 0.97538; median= 0.95572; sdtdev= 0.24661; skew=-0.02334;
SCAN zodi13b (160DCEs): mean= 0.97024; median= 0.94494; sdtdev= 0.24881; skew=-0.08216;
SCAN zodi28b (160DCEs): mean= 0.97335; median= 0.94812; sdtdev= 0.23827; skew= 0.17029;
The histograms are shown in Figure2.
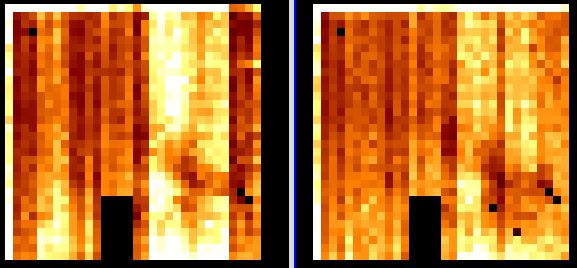
Figure1.
Comparison of 70micron Illumination Corrections obtained in PHOTOMETRY (left) and SCAN modes (right).
Both are displayed from z1=0. to z2=2.
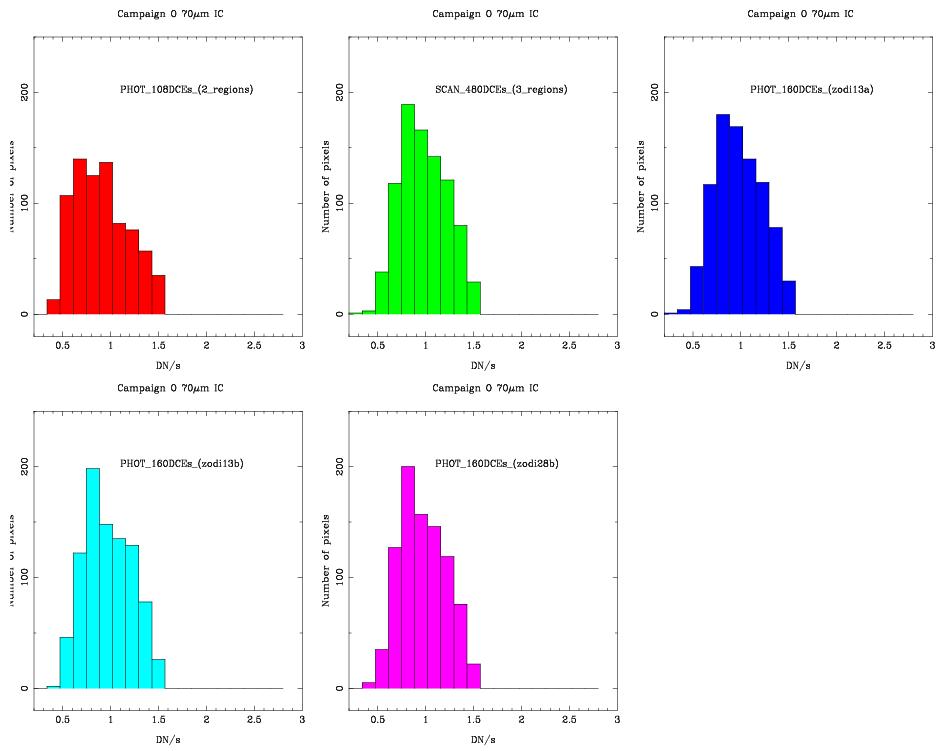
Figure2.
Histograms of the 70micron Illumination Corrections observed in Campaign O
obtained in different modes and different regions of the sky.
A better way to assess the quality of the observed ICs is to remove the
illumination pattern of the 70micron array. To do so, we ratioed different 70micron IC. The
statistics (mean, std, median, mode, skewness, min, max) on the images provides the following:
ratio ICs PHOT(216DCEs)/SCAN(480DCEs): 1.001 0.2204 0.9891 0.9231 -0.1578 0.1151 1.499
Side A alone: 0.9824 0.156 0.9598 0.93 0.6586 0.6511 1.494
Side B alone: 1.02 0.2685 1.06 1.148 -0.4421 0.1151 1.499
ratio ICs PHOT zodi12a/zodi12b: 1.006 0.1233 0.9903 0.9369 0.5158 0.5592 1.443
Side A alone: 0.9845 0.1062 0.9697 0.9373 0.7429 0.7287 1.403
Side B alone: 1.027 0.1347 1.015 1.024 0.2536 0.5592 1.443
ratio ICs SCAN zodi13a/zodi13b: 1.012 0.09866 1.004 1.01 0.2284 0.6913 1.371
Side A alone: 1.023 0.09691 1.012 0.9902 0.1904 0.7036 1.32
Side B alone: 1.002 0.09934 0.9969 0.9742 0.2823 0.6913 1.371
ratio ICs SCAN zodi13a/zodi28b: 1.009 0.09882 1.005 1.002 -0.7553 0.1168 1.348
Side A alone: 1.014 0.09793 1.011 1.002 0.1031 0.7405 1.348
Side B alone: 1.004 0.0995 1.006 0.9992 -1.523 0.1168 1.253
ratio ICs SCAN zodi13b/zodi28b: 1.003 0.115 0.9994 0.9843 -0.3361 0.1128 1.448
Side A alone: 0.9973 0.1098 0.9922 0.9733 0.2669 0.6927 1.448
Side B alone: 1.008 0.1195 0.9992 0.9426 -0.7966 0.1128 1.355
Some examples of the ratios of 70micron are shown in Figure3. The statistics on the
best cases
provides 9% rms over the array, a results which is somewhat larger than Campaign K for
side A, but considerably better for side B.
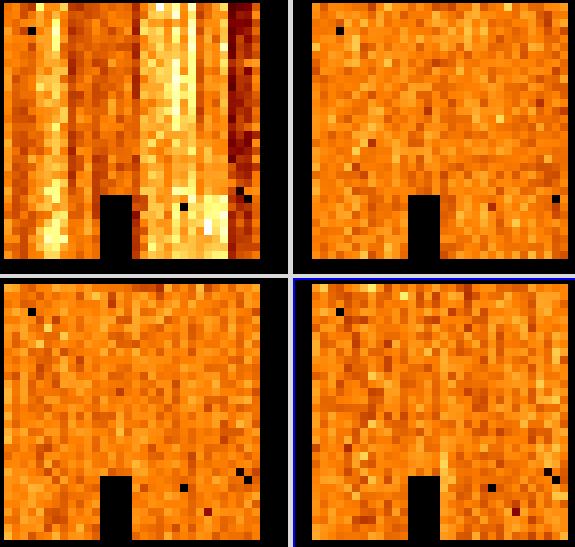
Figure3.
Examples of ratios of 70micron Illumination Corrections: up-left: phot to scan, up-rigth: scan zodi_13a to scan zodi_13b, bottom-left: scan zodi_13a to scan zodi_28b, bottom-right: scan zodi_13b to scan zodi_28b. All images are shown with z1=0 and z2=2.