There is a problem w/ your write-up. Check that you have valied entries for \$CAID and \$Campn in your analysis.php file. If that checks out, then Contact Stansberry"; return ; } // get first matching task $row = mysql_fetch_array($result); $title = $row["title"]; $princ = $row["principal"]; $deputy= $row["deputy"]; $campn0 = $row["campn0"]; $aorkeys = $row["aorkeys"]; // get real name of principal, deputies $princ = ioc_get_person($princ); $princ = $princ[0]; $deps = explode(",",$deputy); foreach ($deps as $depty) { $depty = trim($depty); $depty = ioc_get_person($depty); $depty = $depty[0]; $depty = explode(",",$depty); $depty = $depty[0]; // last names only $deplist[] = $depty; } $deplist = implode(", ", $deplist); $caid = sprintf("%03d",$caid); $file = "mips-".$caid.$campn.".analysis.php"; // if more matches, append the AORKEYS from those $numrows = mysql_num_rows($result); if ($numrows > 1) { $aorkeys = " " . $numrows . " Task Executions:  ". $aorkeys; for ($i=0;$i < mysql_num_rows($result); $i++) { $row = mysql_fetch_array($result); $morekeys = $row["aorkeys"]; $aorkeys = $aorkeys .';  '.$morekeys; } } // END PHP. ?> <? echo "MIPS-$caid, Campaign $campn IOC/SV Analysis"; ?>

Principal:
Deputy:
Analyst:
AORKEYS:
Last Updated:


Task Outcome Summary


Abstract

We have constructed the 70micron ICs obtained in PHOT (wide field) and SCAN modes. This report is the same for MIPS-306 (70micron SCAN IC) and MIPS-918 (70micron PHOT IC) as both modes are analyzed together. The standard deviations of the 70micron ICs over the entire array are approximately 40-50%, but this statistics includes the illumination pattern of the 70micron array.

Analysis

In PHOTOMETRY mode we obtained a 9 point dither map (1 cycle) at 70microns with 3 second DCEs of one region of the sky (zodi_14a) chosen to avoid bright point sources. The offsets between positions are 300 arcseconds. At each position of the dither pattern there are 16 images (4 of which are stim flashes), so a total of 108 sky images were obtained to construct the 70micron Illumination Correction (IC).

In SCAN mode we have observed 2 degrees (3 legs) in fast mode for three different regions of the sky (zodi_13b, zodi_28b, and zodi29a). Each leg has 325 DCEs (10 stims) for a total of 2835 DCEs combining the data from the three regions. Note that two of the 70micron SCAN regions were observed in MIPS-305 and MIPS-307.

The reduction was performed with the DAT programs. We used mips_sloper with sensitive cosmic ray detection (-q option) turning off the electronic non-linearity correction, mips_caler (using the 70micron me_70_darka_CamQ_7nov2003.fits) and mips_enhancer with the following options:

verbose = 0
scale = 1.
filename = ic70_scan
prefix = ic_scan70
nXTile = 1
nYTile = 1
dark = 0
flat = 0
illumination_correction = 1
NormalizeInput = 1
SigmaCut = 3.0
SigmaTolerance = 0.25
MaxIterations = 10
StackSTDEV = 0
OutlierMinPoints = 3
QuartileFactor = 10
OverlapTolerance = 0.5
diagonistics = 1
WriteGeometry = 0
WriteOutlier = 0
WriteTiles = 0
FluxMean = 0
FluxMedian = 1
OverWrite = 1
distortion = 0
UseBoostFrame = 1
reject = 1


Note that we rejected the first DCE after the stim flash (reject = 1 option) and normalized the input images (NormalizeInput = 1 option).

The regions of the sky observed were:


zodi_14a (RA=8:55:25.1305 and Dec=+12:09:32.6938, J2000) with a predicted brightness at 70microns of 16.3 MJy/sr.
zodi_13b (RA=21:05:07.4259 and Dec=-21:54:04.3864, J2000) with a predicted brightness at 70microns of 14.6 MJy/sr.
zodi_28b (RA=21:32:18.5321 and Dec=-19:52:22.7257, J2000) with a predicted brightness at 70microns of 15.9 MJy/sr,
zodi_29a (RA=21:49:42.1042 and Dec=-7:49:51.7263, J2000) with a predicted brightness at 70microns of 12.9 MJy/sr,


The predicted values of the 70micron brightness are from SPOT for the date of the observing (Nov 6, 2003).


Results

The SCAN and PHOT mode 70micron ICs observed in Campaign Q, constructed using 2835DCEs and 108DCEs respectively, are shown in Figure1. Statistics on the images provides the following:


PHOT one reg (108DCEs): mean= 0.77385; median= 0.90536; sdtdev= 0.49979; skew=-0.63324;
SCAN three reg (2835DCEs): mean= 0.85750; median= 0.92437; sdtdev= 0.39260; skew=-0.66403;
SCAN zodi13b (160DCEs): mean= 0.88786; median= 0.92962; sdtdev= 0.35873; skew=-0.73980;
SCAN zodi28b (160DCEs): mean= 0.83994; median= 0.92779; sdtdev= 0.41500; skew=-0.59741;
SCAN zodi29a (160DCEs): mean= 0.81872; median= 0.91328; sdtdev= 0.45088; skew=-0.82867;


The histograms are shown in Figure2.


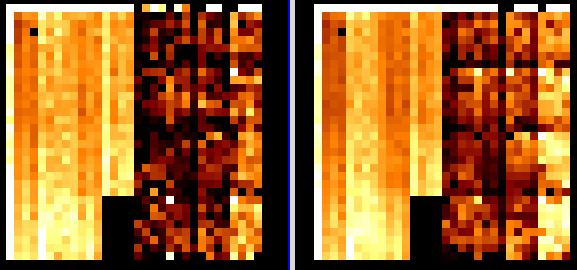
Figure1. Comparison of 70micron Illumination Corrections obtained in PHOTOMETRY (left) and SCAN modes (right). Both are displayed from z1=0. to z2=2.
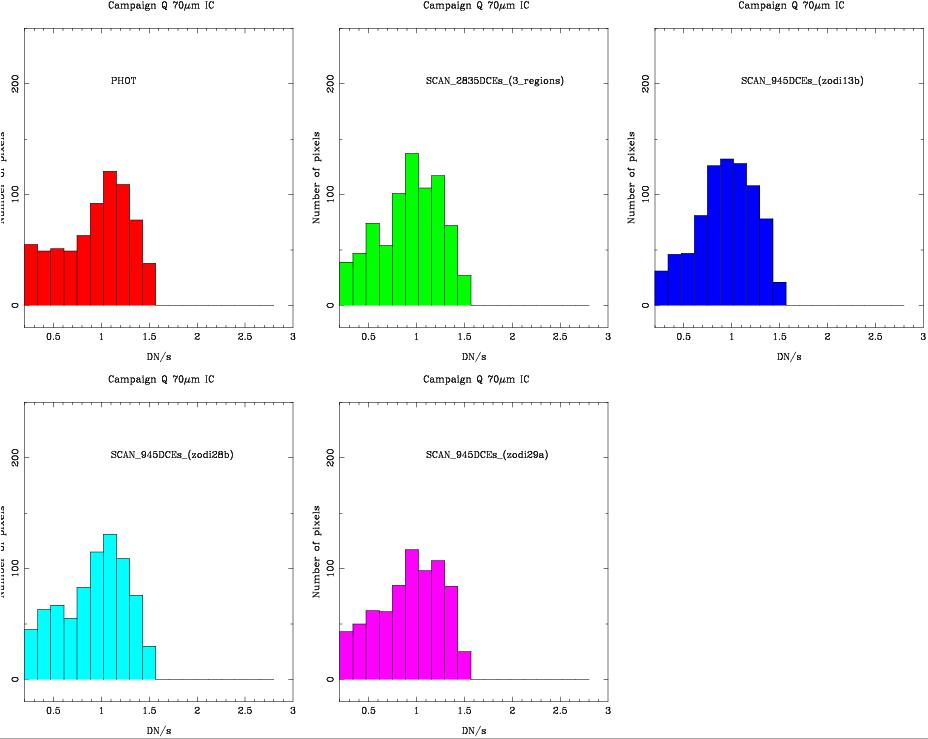


Figure2. Histograms of the 70micron Illumination Corrections observed in Campaign Q obtained in different modes and different regions of the sky.
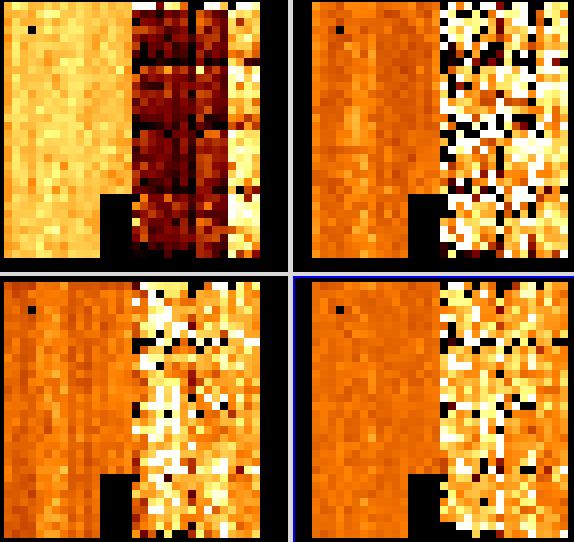

A better way to assess the quality of the observed ICs is to remove the illumination pattern of the 70micron array. To do so, we ratioed different 70micron ICs. The statistics (mean, std, median, mode, skewness, min, max) on the images provides the following:

ratio ICs SCAN(2835DCEs_CamQ)/SCAN(480DCEs_CamP): 1.042    0.681    1.211    1.292    9.581    0.005235    15.16
Side A alone: 1.301   0.1013    1.297    1.294    0.08373    1.051    1.637
Side B alone: 0.7842   0.8842   0.5736   0.5004    9.59    0.005235    15.16

ratio ICs SCAN(2835DCEs)/PHOT(108DCEs): 1.651    4.449    1.117    1.076    14.77    0.001649    87.79
Side A alone: 0.942    0.08897   0.9254   0.8976   0.8802   0.7697    1.245
Side B alone: 2.436    6.368    1.42    1.188    10.23    0.001649    87.79

ratio ICs SCAN zodi13b/zodi28b: 1.322    2.488    1.044    1.003    17.06    0.1186    54.54
Side A alone: 0.9485    0.08865    0.9383   0.8981    0.5822    0.7439    1.288
Side B alone: 1.69    3.467    1.233    1.138    12.2    0.1186    54.54

ratio ICs SCAN zodi13b/zodi29a: 1.232    1.166    1.01   0.9302    12.06   0.2562    24.3
Side A alone: 0.9401    0.04668    0.9337    0.9148    0.8057    0.8283    1.178
Side B alone: 1.532    1.606    1.195    1.126    8.799   0.2562    24.3

ratio ICs SCAN zodi28b/zodi29s: 1.224    3.492   0.9681    0.957    19.15    0.08105    81.92
Side A alone: 0.9976    0.08189    0.9923    0.9485    0.0245    0.8042    1.237
Side B alone: 1.453    4.943    0.9247    0.8665    13.44    0.08105    81.92


Some examples of the ratios of 70micron are shown in Figure3. The statistics on the best cases provides 5% rms over the side A array, a results which is better than previous campaigns (probably due to the use of more DCEs), but side B is considerably worse behavied than Campaigns O and P (anneal?).


Figure3. Examples of ratios of 70micron Illumination Corrections: up-left: scan Campaign Q to Campaign P, up-rigth: SCAN mode IC to PHOT mode IC, bottom-left: scan zodi_13b to scan zodi_28b, bottom-right: scan zodi_13b to scan zodi_29a. All images are shown with z1=0 and z2=2.


We have also compared the ICs in Campaign P and Q for the three regions in common: zodi_13b, zodi_28b, and zodi_29a. The results are:

ratio ICs SCAN zodi_13b CamQ/CamP: 1.063   0.5874    1.175    1.26    3.916    0.009445    8.273
Side A alone: 1.277   0.1197    1.262    1.197   0.4477    0.9632    1.763
Side B alone: 0.8537   0.7609   0.6463   0.5116    4.354    0.009445    8.273

ratio ICs SCAN zodi28b CamQ/CamP: 1.029   0.8028    1.185    1.326    14.15    0.006224    20.16
Side A alone: 1.328   0.1438    1.322    1.396    0.439   0.9585    2.026
Side B alone: 0.7308    1.044   0.5353    0.4521    13.69 0.006224    20.16

ratio ICs SCAN zodi29a CamQ/CamP: 1.066   0.5877    1.213    1.34    1.976 0.00471    6.956
Side A alone: 1.349   0.1595    1.346    1.31   0.4588   0.9979    1.972
Side B alone: 0.7672   0.7133   0.5353   0.4429    3.461    0.00471    6.956


Conclusions

We have constructed 70micron ICs (wide field) obtained in PHOTOMETRY and SCAN modes using four regions of the sky (zodi14a, zodi13b, zodi28b, zodi_29a). The standard deviations of the 70micron ICs over the entire array are approximately 40%-50%, but this statistics includes the illumination pattern of the 70micron array. These values are considerably higher than the results obtained for Campaigns O and P. If we remove the illumination pattern by ratioing two SCAN ICs, we find that the rms is 5%-10% for side A, much worse for side B.

Output and Deliverable Products

70micron IC to be used to reduce data obtained in Campaign Q.

Actions Following Analysis