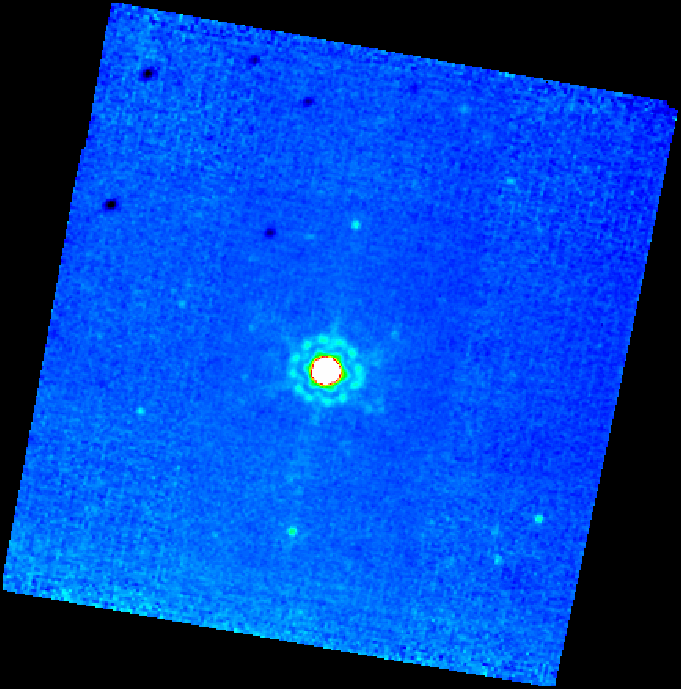
Figure 1: Mosaic of 30 images of HD159330, displayed in a log scale.
Principal:
Deputy:
Analyst:
AORKEYS:
Last Updated:
The data were processed with version 2.15 of the DAT, using the campaign D2 dark and flat images. A centroid measurement and aperture photometry was performed on the star in each of 30 DCEs. These data were used to derive a flux calibration. The data were coadded to make a mosaic, which was examined for background sources or other problems which would bias the flux measurement.
As expected, this task generated a total of 30 Si:As DCEs on the star and 10 more in the stim IER. An offset list for the series of DCEs on the star was generated by centroiding on the star in each image, using IRAF's imexam task. This centroid list was used to generate an offset list for mips_enhancer, which was used to create the mosaic in Figure 1. The offset list was required because the WCS parameters do not accurately reflect the pointing.

Figure 1: Mosaic of 30 images of HD159330,
displayed in a log scale.
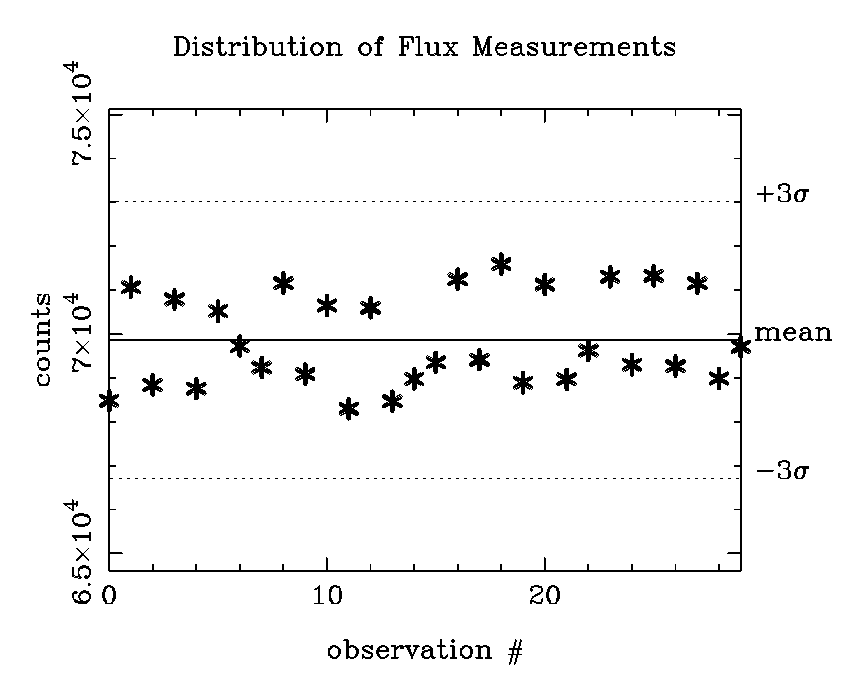
I computed the total counts from the star in all 30 DCEs, using an aperture 6 pixels in radius and a sky annulus 12 to 16 pixels in radius in IRAF's "imexam" task. The counts are 6.986e+04 +/- 1.052e+03 (1.5%), and the distribution is shown in Figure 2. I computed an aperture correction for an aperture this size of 1.15, using a model PSF from Tiny Tim. The flux for the target star (HD159330) is 0.54 Jy at 24µm, so the ratio of DN/s to Jy is 6.986e4 * 1.15 / 0.54 = 1.49e5. This conversion factor differs by 1% from that measured in campaign D1, which used a different target star on a much higher background.

Figure 2: Counts for HD159330 as a
function of DCE number.
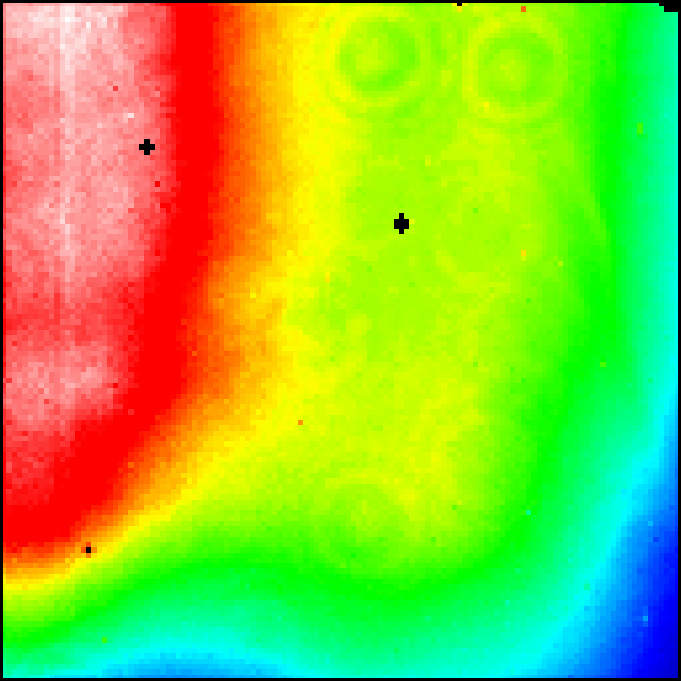
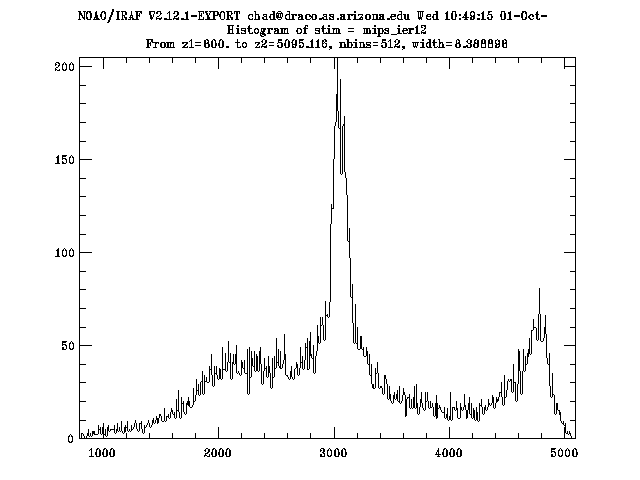
The stimulator IER behaved as expected, producing 3 dark DCEs followed by 7 images of the flat-field stimulator. The data were processed with mips_sloper in a fashion identical to that described above for the sky images. The stimulator images were averaged, and this image of the stimulator is shown in Figure 3, while the histogram of the data values is shown in Figure 4. The mean data value in the stimulator image (ignoring values below 100 DN/s, which are all bad pixels) is 3126 DN/s, much lower than the value discussed in the analysis of MIPS-115. The MIPS-115 data had not passed through the DAT, though, and thus have had no linearity or droop corrections applied. I can also see that the response of the first DCE is lower than subsequent ones, although that seems to be part of a broad trend of increasing signal with DCE number, as can be seen in Figure 5.

Figure 3: Flat-field stimulator image.

Figure 4: Histogram of stimulator image
counts.

Figure 5: Trend of mean data values in
the 7 stimulator DCEs.
The flux calibration is delivered in this writeup. The calibration images and mosaic are available should they be needed. I do not yet have a comparison of the DAT and SSC pipeline results.