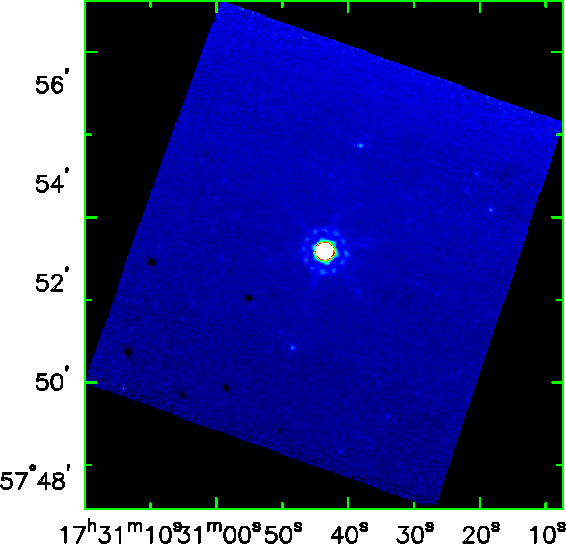
Figure 1: Mosaic of 30 images of HD159330, displayed in a log scale.
Principal:
Deputy:
Analyst:
AORKEYS:
Last Updated:
The data were processed with version 2.21 of the DAT, using the campaign F dark and flat images. Note that these data are now flipped along the x axis and thus have the proper orientation. A centroid measurement and aperture photometry was performed on the star in each of 30 DCEs. These data were used to derive a flux calibration. The data were coadded to make a mosaic, which was examined for background sources or other problems which would bias the flux measurement.
As expected, this task generated a total of 30 Si:As DCEs on the star and 10 more in the stim IER. An offset list for the series of DCEs on the star was generated by centroiding on the star in each image, using IRAF's imexam task. This centroid list was used to generate an offset list for mips_enhancer, which was used to create the mosaic in Figure 1. The offset list was required because some of the images still do not contain reconstructed pointing. On the plus side, the flip and WCS update appears to work correctly, as can be seen by comparing Figure 1 to the SPOT visualization of this observation (Figure 2).

Figure 1: Mosaic of 30 images of
HD159330, displayed in a log scale.
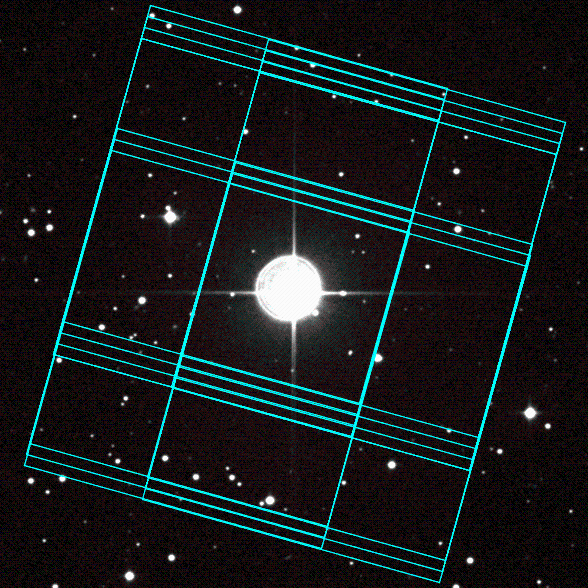
Figure 2: SPOT visualization of this
observation.
I computed the total counts from the star in all 30 DCEs, using an aperture 6 pixels in radius and a sky annulus 12 to 16 pixels in radius in IRAF's "imexam" task. The counts are 6.972e+04 ± 1.096e+03 (1.6%) DN/s (ignoring the boost DCEs), and the distribution is shown in Figure 3. The median counts in the sky annuli are 3.542e+02 ± 1.678e+00 (0.5%) DN/s. I computed an aperture correction for an aperture this size of 1.15, using a model PSF from Tiny Tim. The flux for the target star (HD159330) is 0.54 Jy at 24µm, so the ratio of DN/s to Jy is 6.972e4 * 1.15 / 0.54 = 1.48e5. This conversion factor is very similar to that measured for this star during other campaigns. The implied background level is 3.542e+02 DN/s / 1.48e5 DN/s/Jy * 1e-6 MJy/Jy / (2.47/206265)² sr/pix = 16.7 MJy/sr, higher than the SPOT prediction of 13.4 MJy/sr for this date.

Figure 3: Counts for HD159330 as a
function of DCE number.
The photometry pattern, where aperture counts on the top of the array are lower than on the bottom half, is still present in the data and is still being investigated. I have attempted to use a special 3s dark and also tried turning off the linearity correction and have not been able to make the effect go away.
The stimulator IER behaved as expected, producing 3 dark DCEs followed by 7 images of the flat-field stimulator. The data were processed with mips_sloper in a fashion identical to that described above for the sky images. The stimulator images were averaged, and this image of the stimulator is shown in Figure 4, while the histogram of the data values is shown in Figure 5. The mean data value in the stimulator image (ignoring values below 100 DN/s, which are all bad pixels) is 3184 DN/s, similar to, if slightly higher than, values measured in earlier campaigns. The trend with DCE number, shown in Figure 6, is similar to that seen earlier, but evidence now suggests that the first value is computed incorrectly in the flight software and should be discounted.
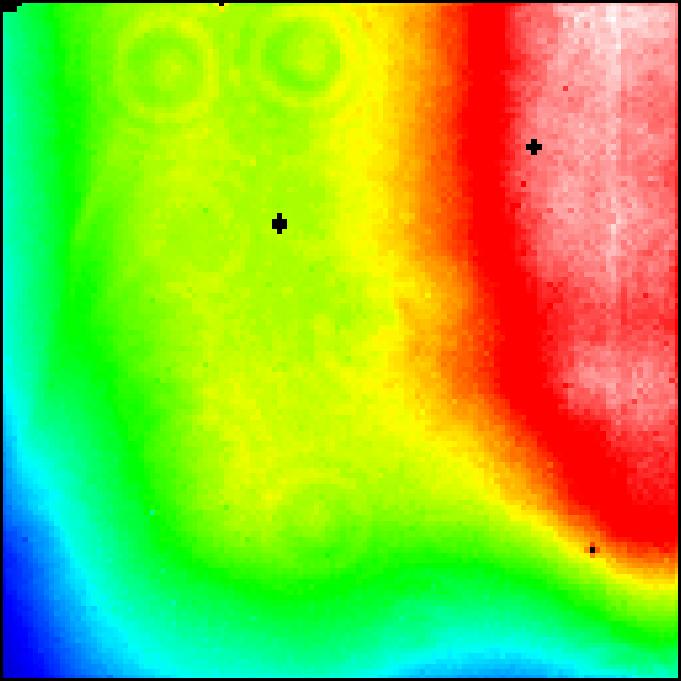
Figure 4: Flat-field stimulator image.
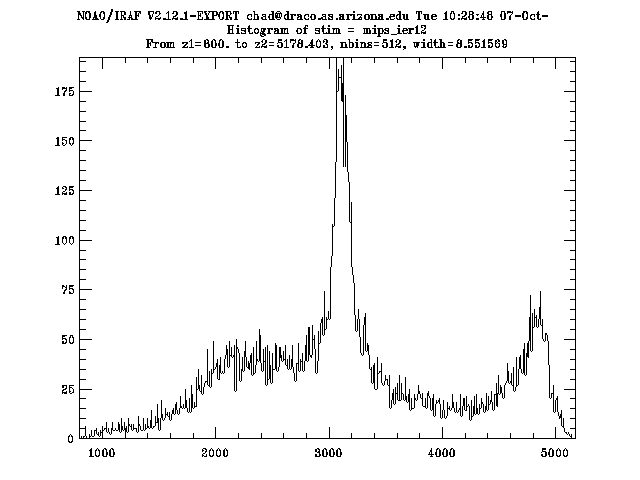
Figure 5: Histogram of stimulator image
counts.
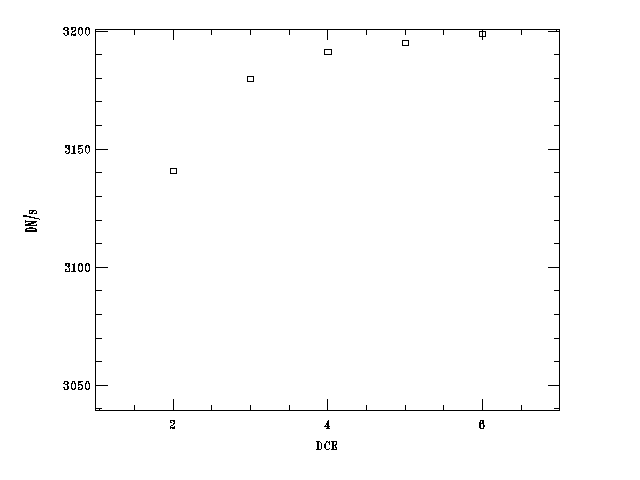
Figure 6: Trend of mean data values in the
7 stimulator DCEs.
The flux calibration is delivered in this writeup. The calibration images and mosaic are available should they be needed. Initial comparisons between the DAT and SSC pipeline results indicate that the return answers similar to within about 1-2%.
We continue to investigate the photometry differences between the top and bottom halves of the array.