mips-920H.analysis.php6«»Ąt+»Ąt+mBIN‚­M Contact Stansberry - "; echo " there is a problem w/ your write-up.\n"; return ; } $row = mysql_fetch_array($result); $title = $row["title"]; $princ = $row["principal"]; $deputy= $row["deputy"]; $campn0 = $row["campn0"]; $aorkeys = $row["aorkeys"]; // get real name of principal, deputies $princ = ioc_get_person($princ); $princ = $princ[0]; $deps = explode(",",$deputy); foreach ($deps as $depty) { $depty = trim($depty); $depty = ioc_get_person($depty); $depty = $depty[0]; $depty = explode(",",$depty); $depty = $depty[0]; // last names only $deplist[] = $depty; } $deplist = implode(", ", $deplist); $caid = sprintf("%03d",$caid); $file = "mips-".$caid.$campn.".analysis.php"; // END PHP. ?> <? echo "MIPS-$caid, Campaign $campn IOC/SV Analysis"; ?>

Principal:
Deputy:
Analyst:
AORKEYS:
Last Updated:


Task Outcome Summary


Abstract

This is the routine 24µm flux calibration. The target was HD159330. The task has been excuted five times over the whole campaign to look for any photometry variability within a campaign. Each photometry AOR produces 30 DCEs. The data are all nominal. The reconstructed pointing for 24um seems improved compared to the previsous campaign, but not yet perfect since the mosaiced image shows elongation in the core. The calibration is 1.47e5 DN/s/Jy and is well-matched to previous calibration measurements within the uncertainties.

Analysis

The data were processed with version 2.32 of the DAT, using the campaign H dark image and a combined flat image of campaign E,F and G. A centroid measurement and aperture photometry was performed on the star in each of 30 DCEs. These data were used to derive a flux calibration. The data were coadded to make a mosaic, which was examined for background sources or other problems which would bias the flux measurement.

Results

Data Collected

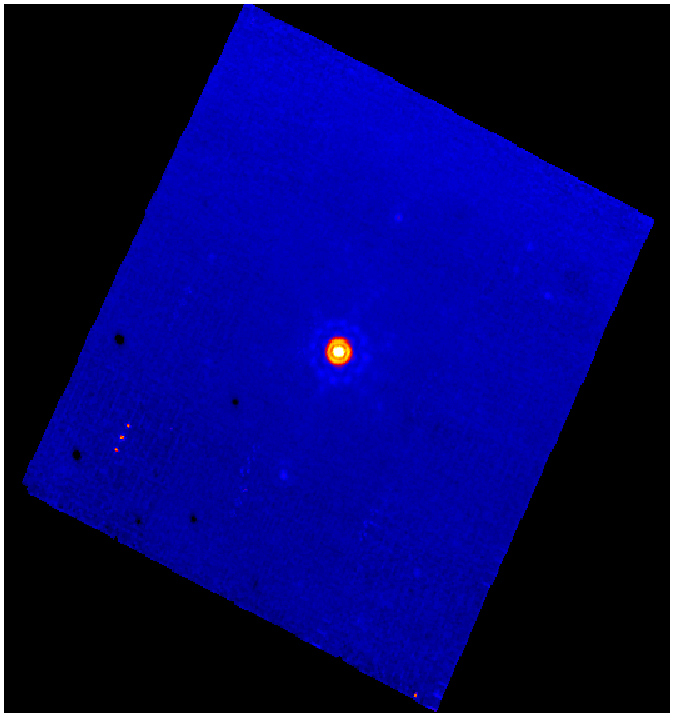
As expected, this task generated a total of 30 Si:As DCEs on the star and 10 more in the stim IER, for each execution. A mosaiced image is shown in Figure 3.


System Throughput


We computed the total counts from the star in each of the 30 DCEs, using an aperture 6 pixels in radius and a sky annulus 12 to 16 pixels in radius. The combined of all five executions after applying the 1.15 aperture correction are 7.96e+04 ± 1.61e+02 (0.2%) DN/s (ignoring the boost DCEs) for the star, and 348.86 ± 0.47 (0.1%) DN/s for the sky annulus. The results for all five executions, plus the mean results are shown in figure 1. The mosaic'd image from the SSC post-BCD is shown in figure 2.

The flux density for the target star (HD159330) is 0.54 Jy at 24µm, which yileds a conversion factor = 1.47e5 DN/s/Jy. This conversion factor is very similar to that measured for this star during other campaigns. The implied background level is 348.86 DN/s / 1.47e5 DN/s/Jy * 1e-6 MJy/Jy / (2.47/206265)² sr/pix = 16.5 MJy/sr. This is 22% higher than the prediction of 13.43 MJy/sr by SPOT.
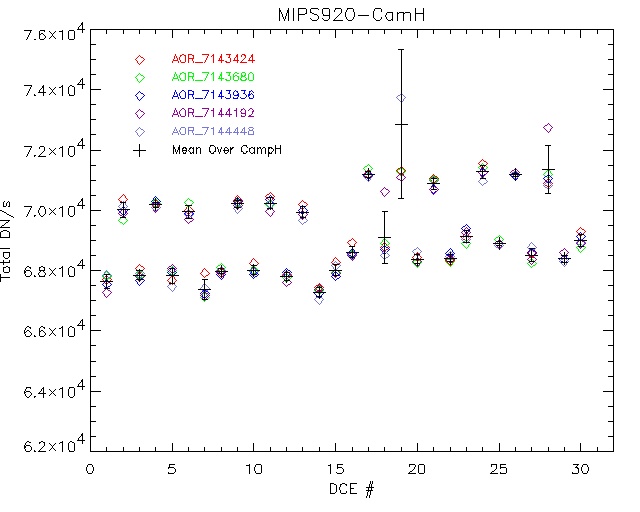

Figure 1: 
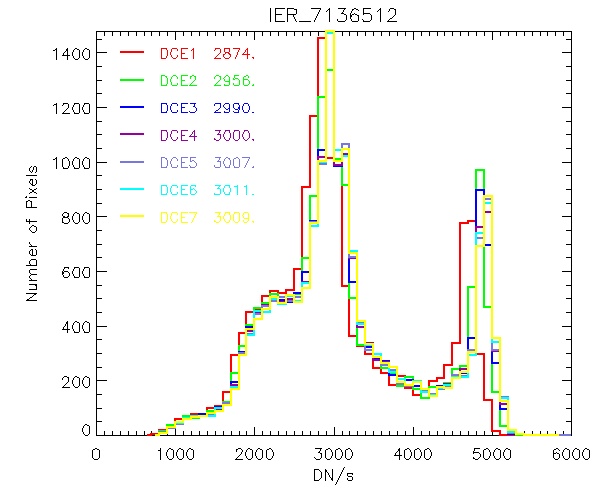
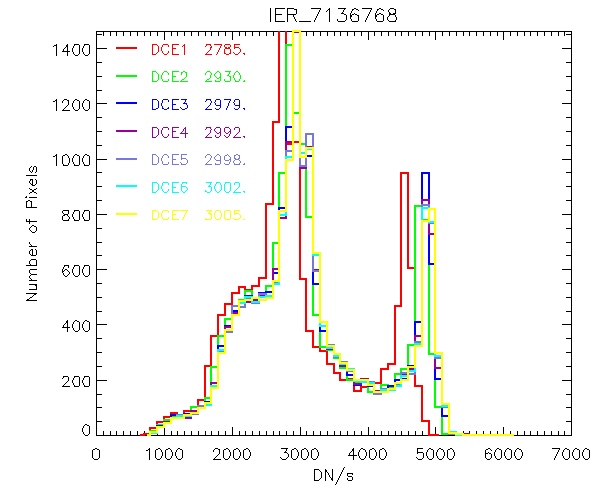
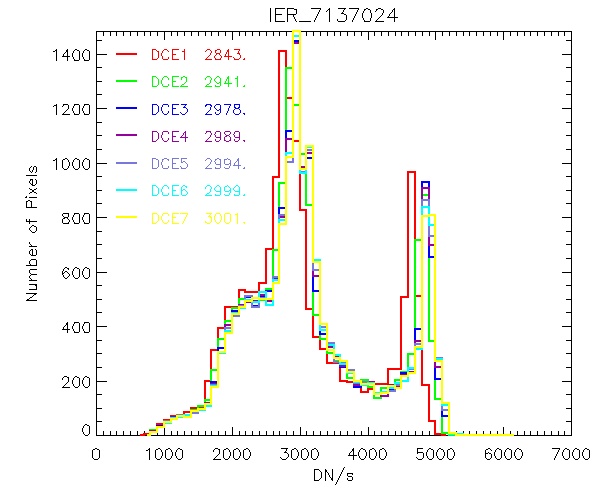
The photometry in each DCE (representing in different color) for all the five AORs is plotted below. The mean value for each DCE is also plotted in black crosses with error bar representing the variation. (Note that the photometry in DCE#18,#19, and #28 is affected by cosic rays; therefore, larger error bars.)

Here is the mean and sigma for each DCE.


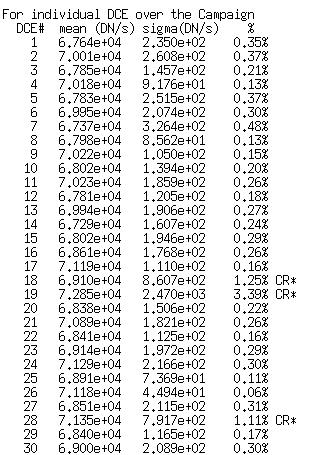
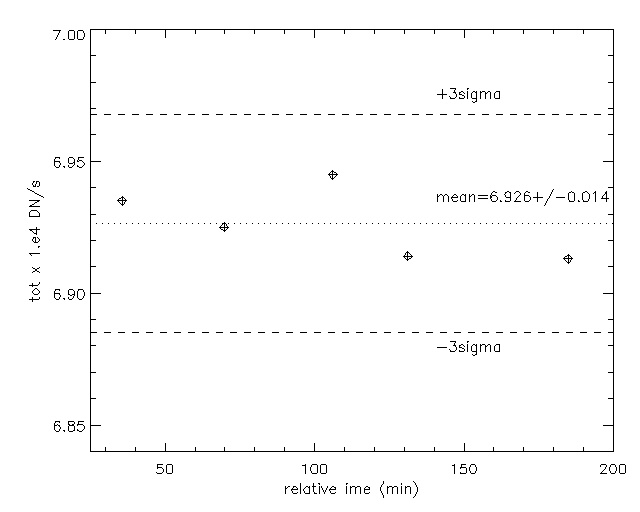
Average photometry over 30 DCEs in each ARO v.s. observed time is plotted below, the 1-sigma variation is less than 0.2% during the campaign.

The average total counts (before aperture correction) and the correction factors are listed below.
filename
total counts (DN/s)
CF (DN/s/Jy)
mips920_1
6.935e4+/-1.316e3
1.472e5
mips920_2
6.925e4+/-1.377e3
1.470e5
mips920_3
6.945e4+/-1.931e3
1.474e5
mips920_4
6.932e4+/-1.440e3
1.471e5
mips920_5
6.929e4+/-1.516e3
1.470e5

MIPS_enhancer results:

All the DCEs (except for the two boost frames) were mosaick together using mips_enhancer with offset list. The command is:
    mips_enhancer -f mips_AOR_7143424_pht_A24_P24_pos1_3s.cal.fits -s 0.125 -IB -SK -x 2 -y 2 -o mips_AOR_7143424offset
    -l offset.7143424


Figure 2: Mosaicked image of HD159330 using MIPS Enhancer.


Aperture photometry was performed in the mosaic images, with the same aperture size (48 pixel in the subsample mosaic image; i.e, 6 pixel in the original pixel grid). The total counts within the aperture are divided by 64 for flux conservation. The results  (before aperture correction) as well as the conversion factor (*1.146/0.54) are listed in the table below.

filename
total counts (DN/s)
sky (DN/s)
CF (DN/s/Jy)
mips920_1
6.520e4+/-1.151e3
349.3+/-3.12
1.384e5
mips920_2
6.508e4+/-1.149e3
349.2+/-3.28
1.381e5
mips920_3
6.522e4+/-1.151e3
348.9+/-3.21
1.384e5
mips920_4
6.509e4+/-1.148e3
348.1+/-3.20
1.381e5
mips920_5
6.500e4+/-1.146e3
348.8+/-3.14
1.379e5


Stimulator

The stimulator IER behaved as expected, producing 3 dark DCEs followed by 7 images of the flat-field stimulator. The data were processed with mips_sloper in a fashion identical to that described above for the sky images. The stimulator images were averaged and the mean data value in the stimulator image (ignoring values below 100 DN/s, which are all bad pixels) is XXXX DN/s, similar to values measured in earlier campaigns.


MIPS IER120 task has been repeated five times (just like MIPS920) to monitor stim repeatability during one campaign.
Following figures show the historgram over the whole array in individual DCE. The 5-sigmaclip mean value is also listed in each DCE.  (Note that 1st DCE has SUR on-broad algorithm wrong, so the statistics from DCE#1 should be ignored.)


Overall, the historgrams in individual DCE are very similar, indicating good stim repeatability.

Except for the first DCE, the 5-sigmaclip mean value has less than 0.2% variation over campaign H.


Conclusions


Output and Deliverable Products


Actions Following Analysis