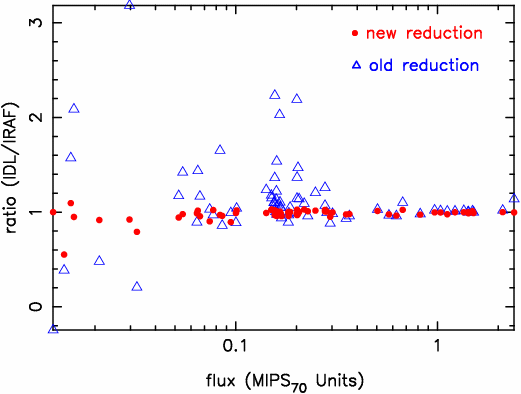
Figure 1: Comparison of old and new photometry procedures.
Principal:
Deputy:
Analyst:
AORKEYS:
Last Updated:
This task writeup describes the analysis of the MIPS 70µm flux calibrator measurements from late in IOC (campaign R) up to and including campaign 7 of nominal operations. 75 star observations have been reduced using a new photometry reduction tool and a new calibration factor determined. The new calibration factor is 1.58e4±1.87e2 µJy/arcsec²/MIPS_unit (or 6.72e2±7.97 MJy/sr/MIPS_unit). The data were all reduced using the campaign 5-7 illumination correction (IC) supplied by the SSC (and renormalized by K. Gordon), and so this calibration factor only applies to data reduced using the same IC or one that is similarly normalized. This IC is the default in the MIPS DAT as of this writing, if the latest set of calibration files (11 June 2004) has been installed .
The data were processed using version 2.73 of the MIPS DAT and K. Gordon's "redphot" IDL routine. The main improvements supplied by the IDL routine are a column-by-column subtraction and an additional subtraction of the median of the stack of exposures. These corrections are measured while excluding the region around the source and significantly improve the removal of array artifacts from the data, thus greatly reducing the scatter in the calibrator measurements. The data were combined using the following flags to mips_enhancer: -OW -t 0 -RR -s 1 -r 1 -dy -SK -W2.
Images of the reduced data can be found here.
A comparison of photomery measured with and without the new routine is shown in Figure 1, where each data reduction method has been compared to photometry performed in IRAF using the "imexam" task on the data reduced in the "new" way (i.e., using the "redphot" routine). Thus, the IRAF measurements are made on the same data in both cases and are there merely to provide a fiducial point to compare the two reduction methods.

Figure 1: Comparison of old and new
photometry procedures.
A text file containing the measurements can be found here.
The IDL routine discussed above performs photometry automatically, assuming the location of the source on the array. This automatic photometry has been compared to photometry done by hand using IRAF's "imexam" task, as shown in Figure 2. The data plotted in the figure are the same as those labeled as "new reduction" in Figure 1, except here the scale covers a smaller range, the flux is in Jy, and the points have error bars. The IRAF and IDL techniques agree well except at the faintest fluxes, where the sources are not detected at a significant level. The error bars reflect the scatter in the background annulus, as computed by the "redphot" script. The two methods agree well enough that we will use the automatically measured photometry henceforth.
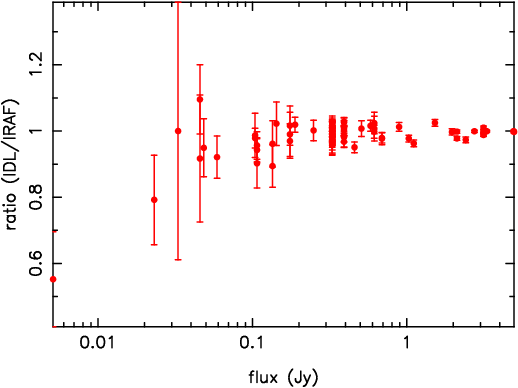
Figure 2: Comparison of IRAF and IDL
photometry
The repeatability of the measurements of the routine calibrators, HD 163588 and HD 180711, is plotted in Figure 3 where the measurements of each star have been normalized to the average value. The scatter of the 24 HD 163588 measurements is 6%. There is possibly a weak tendency for measurements to get fainter with time, but more measurements will be required to demonstrate whether this trend is real or not.
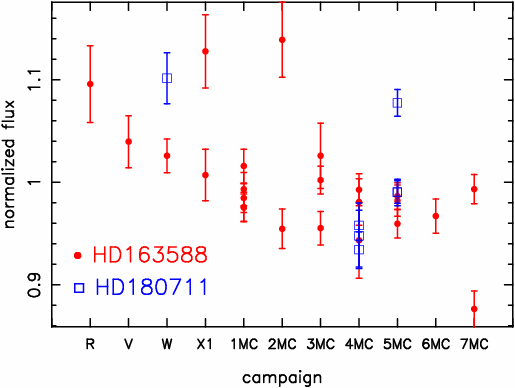
Figure 3: Repeatability of routine
calibrators
The calibration factor as a function of flux has been computed by dividing the predicted flux of each target by the square of the pixel size (9.902 arcsec. in the data presented here) and by the aperture-corrected measured flux. The aperture used in each case is 3 pixels in radius, with a background annulus from 4 to 8 pixels in radius. The aperture correction was computed using a finely-sampled (1 arcsec. pixels) PSF model (generated by STinyTim), taking into account the subtraction of the background annulus, and has a value of 1.348. The results are plotted in Figure 4, where the error bars are derived from the scatter of the pixels values in the background annulus. There are a few discrepant sources evident in the plot. Two of these can be accounted for: HD 89484 (at 2.4 Jy) is a known variable, and HD 158460 (at 5 mJy) has a poorly-predicted flux, possibly due to a weak debris disk (this A star is brighter than expected at 24µm, too). The data are plotted again in Figure 5 with these two sources removed. As observed in the campaign W linearity check task, there is possibly a weak nonlinearity present in the data - more faint stars and application of the electronic linearity correction will be needed to confirm this trend.
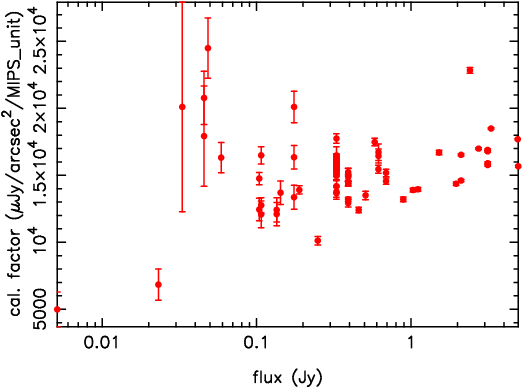
Figure 4: Calibration factor as a
function of flux
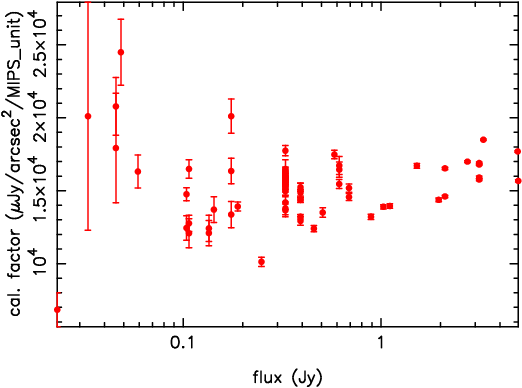
Figure 5: Calibration factor,
cleaned of known bad sources
We have plotted the calibration factor as a function of background (predicted with SPOT) in Figure 6. There is no evident effect of background on the calibration factor.
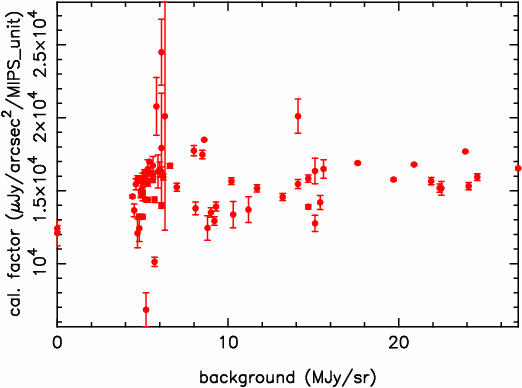
Figure 6: Calibration factor as a
function of background
We have plotted the calibration factor as a function of calibrator spectral type (which we have converted to an effective temperature) in Figure 7. There is no evident effect of spectral type on the calibration factor, although the data are still dominated by cool giants - more solar analogs and A stars need to be observed.
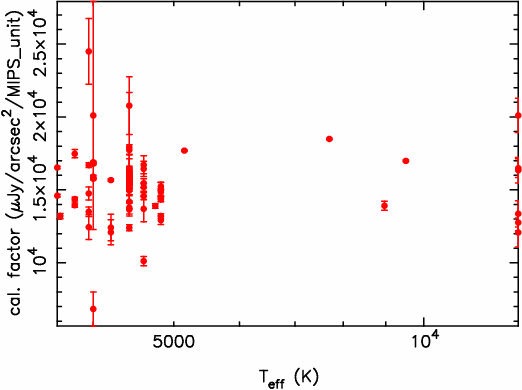
Figure 7: Calibration factor as a
function of calibrator effective temperature
We computed the calibration factor as a function of integration time and find that the 3 and 10 second DCEs agree within the uncertainties (computed from the scatter in the data).
The calibrator sample data (excluding HD 158460 and HD 89484 as discussed above) are plotted in Figure 8, along with a linear fit (the fit was done in linear space, although plotted in logarithmic form here) to the data is plotted in Figure 8. As with the 24µm calibration factor, the slope of the fit was used to determine the calibration factor. The 70µm wide-field calibration factor is 1.58e4±1.87e2 µJy/arcsec²/MIPS_unit, about 6% higher than the value determined in IOC using just a few measurements of HD 163588. The difference is easily explained by the greater number of stars used in this measurement, and the possibility that the normalization of the ICs used was slightly different. The calibration factor in MJy/sr/MIPS_unit is 6.72e2±7.97.
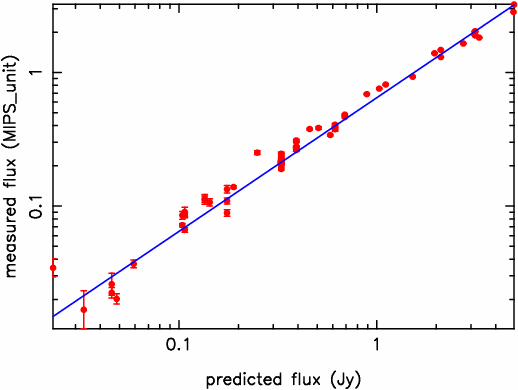
Figure 8: Fit to calibration data used to
derive calibration factor