Principal:
Deputy:
Analyst:
AORKEYS:
Last Updated:
The data were processed with version 2.50 of the DAT, turning off the electronic nonlinearity correction and using the calibration files specific to campaign R. This task executed twice in this campaign, so I took advantage of the large amount of data (132 non-stim DCEs) to examine repeatability and look for trends in the data. The details are discussed in the next section.
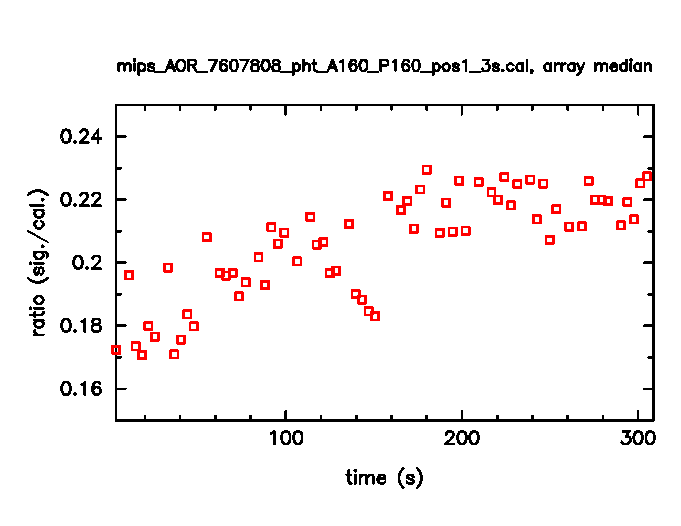
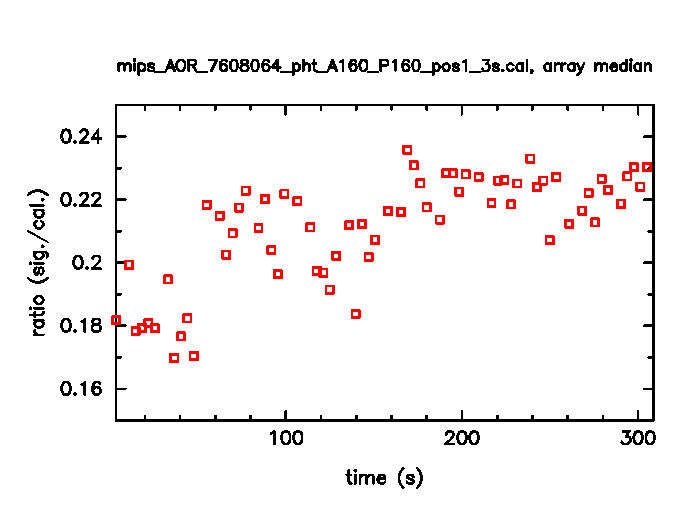
Even after calibration by the stimulator flashes, both sets of data show an increase in signal of about 20% over the first 200s of the observation which flattens out in the final 100s, as shown in Figure 1. (This should be compared to the 60% increase over the same period before the stimflash calibration.) The overall level of the median array signal repeated well, increasing by only 2% (from 0.206 to 0.211) between observations. The effect is similar to that observed during ground test in data following an anneal (as summarized in this report). Since these data followed soon after an anneal (AORKEY 7607808 was the next observation after an anneal, while 7608064 followed a 20-minute observation that followed an anneal), it is possible we are observing recovery from the anneal. As shown below, this does not have a strong effect on background-subtracted photometry measurements, but it is likely to have an effect on matching background levels in mosaicked data.
 |
 |
The PSF of a bright stellar source changes as a function of position on the array. This is demonstrated in Figure 2, where I have mosaicked the data in groups defined by position in columns along the array. The data were mosaicked in IRAF, with no distortion correction applied, and they have been subsampled by a factor of 2. The sampling improvement is only apparent in the middle two panels, where more data contributed to the mosaics. Note that the center of the PSF in the left-most panel is saturated.
 |
 |
 |
 |
The PSF behavior across the array is also observed in other observations of stars, for example in the focal plane survey observations from Campaign Q, shown in Figure 3. The PSF appears to be most elongated near the center of the array.
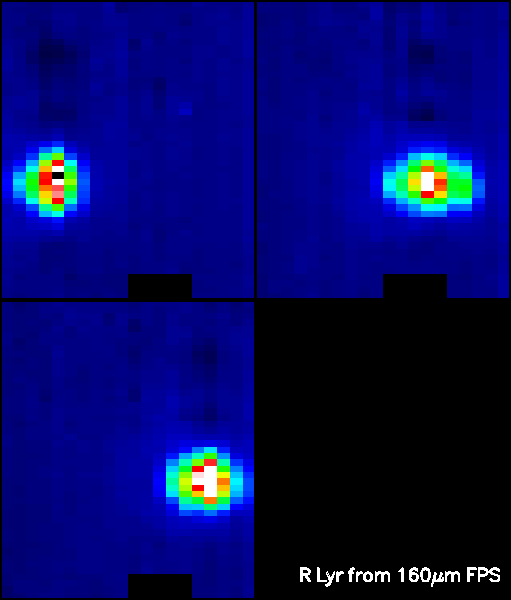
Figure 3: Mosaicked images of R Lyr,
grouped according to location on the array.
The PSF can be characterized as having two components, one bright component and a fainter one which generally lies to the left of and below the bright component in this array orientation. The bright component is likely due to the short-wavelength light reflected off the blocking filter (the "leak"), while the faint component is likely the true 160µm source. The change in PSF shape appears to be due to the two components changing their relative separations as a function of position on the array. A source with a spectrum much redder than a star (and presumably only weakly affected by the leak) does not suffer from the same PSF changes, as shown in Figure 4.

Figure 4: Mosaicked images of HD
131873 and Mrk 279, grouped according to location on the array. The data were
taken in Campaign V as part of the spectral leak check. The source above Mrk
279 is a nearby galaxy.
A cut across the images shows a double peak in the stellar image, while there is only a single peak in the galaxy image. Figure 5 shows that the position of the galaxy image coincides with the fainter of the two peaks in the stellar image.
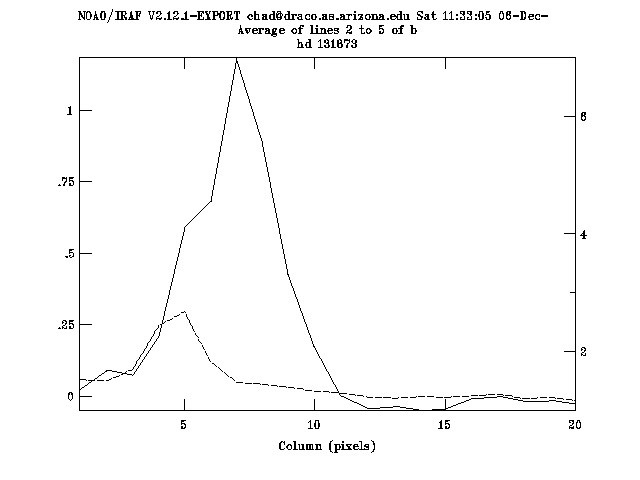
Figure 5: The profile along the
center 3 rows of the array from the data in the third panels from the left in
Figure 4. The solid line is the profile of HD 131873 while the dashed line is
Mrk 279.
I crudely measured the repeatablity of the source measurements by first mosaicking each full image of the source separately, which resulted in 24 images of the source. I then performed simple aperture photometry (using a 4-pixel radius) on each image, rejecting 4 images in which the center pixel of the PSF was saturated. The 20 measurements had a scatter of 16%, as shown in Figure 5, and showed a clear dependence on position. As expected, all the measurements of the source position near the center of the array are lower than those on the edge of the array, presumably because the increased separation of the two components there is causing some flux to be lost from the aperture. The data shown in Figure 5 are in the same time order as those in Figure 1; any sign of the rise in the measurements shown in Figure 1 is probably masked by the PSF shape effects. Despite this, an effect as large as 20% can probably be ruled out. This would be consistent with the measurements made on the ground (which are summarized in the report referenced above).
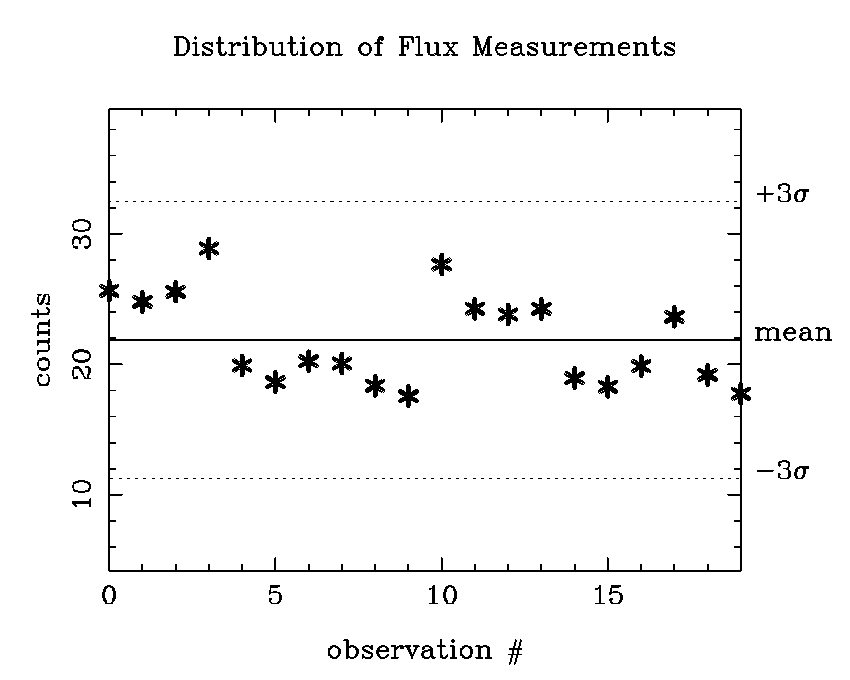
Figure 6: Aperture measurements of HD
131873.
The 160µm filter leak severely impacts the utility of ordinary stars as flux calibrators. For sources with a spectral shape similar to a star, the leak is the dominant signal. Furthermore, the leak appears to change the shape of the PSF as a function of position on the array.
Repeatability appears good, as I was able to achieve 16% repeatablity across two executions of the task and using very crude photometry.
none