Asteroid-Based Calibration of MIPS 160um Channel
John Stansberry, Myra Blaylock
Last Updated: 2005 Dec. 13
Abstract
We derive a new absolute calibration of the MIPS 160um band based
on observations of asteroids. The calibration strategy relies on
near-simultaneous observations at 70 and 160um in all cases, and at
24um for about 1/2 the sample. Photometry in the shorter bands is
fit by a Standard Thermal Model (STM) or a blackbody. The 160um flux
is predicted from those fits and compared with the observed counts
in the 160um band to derive the calibration. The calibration based
on STM fits is TBD. The calibration based on blackbody fits is
1075±11 uJy/"2/U160, and represents a 7.5%
increase from the current calibration factor. The response of the
detectors appears to be linear over the flux range 0.1 - 3 Jy.
Introduction
The 160um channel of MIPS is being calibrated
using observations of asteroids. This is in contrast to the MIPS 24
and 70um channels, which rely for their calibration on observations of
stars. The 160um channel suffers from a short-wavelength (about 1.6um
light) ghost image, which reflects (diffusely) off a surface of the
band-pass filter. This short-wavelength light is focused onto the 160um
detectors without passing through any other filters, and dominates the
signal from the 160um detectors for sources with blue spectral slopes
(i.e. stars). Unfortunately the image of the 1.6um light is about
10x brighter than 160um image, and the two images overlap. Hence,
stars cannot be used to calibrate the response of the detectors to 160um
photons. Thermal emission from main-belt asteroids peaks near 20um, and
their (reflected) near-IR brightness is much weaker relative to their
160um brightness than for stars; the image of an asteroid on the 160um
array is strongly dominated by the 160um photons, making it possible
(in principle) to use asteroids as calibrators.
Calibration Strategy
Unfortunately the spectral energy
distributions (SEDs) of asteroids are difficult to predict due to
temperature variations across the surface, are time-variable due to
rotation and changing distance from the Sun and observer, and are poorly
characterized at far-IR wavelengths. Because of these difficulties in
predicting the 160um flux from a particular asteroid for a particular
observing circumstance, we adopted a calibration strategy that relies on
near-simultaneous observations of asteroids at 24, 70 and 160um, and then
bootstraps the 160um calibration from the well-understood calibrations
at 24 and 70um. Additionally, we have observed many asteroids so that we
can use the average properties of the data to derive the calibration,
rather than relying on detailed efforts to model the thermal emission
of individual asteroids. The emission from asteroids at wavelengths
beyond 60um has not been characterized for very many objects (ISO did
do a good job on this, but only for a few large asteroids having very
weak rotational lightcurves). Because of that, we felt that it was
very important to characterize the thermal emission of our calibration
targets at both 24 and 70um, and use SEDs fitted to both bands
to predict the 160um flux.
Saturation limits introduce a complication in trying to observe any
particular asteroid in all 3 MIPS bands. The 24um channel saturates at
around 3Jy. For typical asteroid SEDs, this limits the maximum 160um
brightness that can be related back to un-saturated 24um observations
to a bit under 0.5Jy. Sensitivity and confusion limits at 160um
limit the dimmest asteroids that can be used to brighter than about
0.1Jy at 160um. Thus, the dynamic range of the 160um fluxes that can be
directly tied to 24um observations is only a factor of 5, from 100mJy to
500mJy. The saturation limit at 70um, 23Jy, does not place any restricion
on sources that can be observed at both 70 and 160um (the 160um saturation
limit, 3Jy, is about 1/2 of the 160um flux from an asteroid with a 23Jy
70um brightness).
These facts lead us to adopt a 2-tiered observation and calibration
strategy:
- An asteroid is observed nearly simultaneously in 3 (24, 70, 160) or
2 (70 & 160) MIPS bands. This limits any impact from asteroid
rotation.
- We observe asteroids with predicted 24um fluxes < 3Jy in all 3
MIPS bands.
- We fit the 24 and 70um photometry with model SEDs (Blackbody and
Standard Thermal Model) to predict the 160um flux.
- For all of these "3-color" asteroids, we track the ratio of the
observed 70um to the predicted 160um flux (F70/P160).
- The mean of F70/P160 we adopt as the "canonical" 70/160 color of
our sample. That color has an uncertainty given by the standard
deviation of the individual determinations.
- For asteroids with predicted 24um fluxes > 3Jy, and predicted
70um fluxes < 18Jy, we observe at 70 and 160um only.
- For these "2-color" asteroids, we use the average value of F70/P160
from the 3-color objects to predict the 160um flux based on the observed
70um flux.
- We plot the observed 160um signal from all objects vs. their predicted
160um fluxes.
- We fit a line to the observed vs. predicted data to compute the
calibration factor relating flux to counts (the slope of the fitted line).
Observations
87 individual observations of asteroids were made through the 24th
MIPS campaign (between December 2003 and September 2005). Of those,
58 resulted in useable detections at 160um. 31 of those observations
were 3-color, and 27 were 2-color (70 & 160 only). All observations
were made using the photometry AOT. The early observations used a 3x1
raster map at 160um, with the 3 positions along the long dimension of
the array (resulting in very skinny mosaics, with little sky around the
object). Around campaign 17 we changed to a 1x3 cluster at 160um, which
provides a more square-ish mosaic, and a fairly generous sky region
completely surrounding the 160um PSF. For these later observations 2
AORs are required: one to take the 24 and 70um data, and a second to take
the 160um cluster map. These AORs are associated by a chain-constraint,
such that they get executed sequentially without any interruption (to
minimize and impacts from asteroid rotation).
All observations were done while tracking the motion of the asteroid.
In all cases at 24 and 70um the motion of the target relative to the
width of the PSF was negligible during the duration of the observation.
At 160um some observations were long enough that some target motion
was noticeable. In such cases the data had to be re-mosaicked to account
for the motion. (The standard mosaicking procedure generates an image that
is stationary in RA-Dec, resulting in the asteroid being streaked even
though the telesope was tracking... Don't ask.)
The pointing information for some of the 160um observations is
incorrect. This is because the 160um frame table was spuriously tuned
such that the 1.6um image from stellar sources was originally thought
to be the 160um image. Because the two images are displaced by 10-15",
the FITS header information based on the early frame table was incorrect.
The main result of this is that photometry on the 160um images cannot
reliably be done in an automated fashion using just the pointing
information in the FITS headers to find the target in the images.
Predictions
We used predicted fluxes for the asteroids to generate AORs for each
campaign. The predictions were generated by Bidushi Bhattacharya (SSC IRAC
IST) using the Standard Thermal Model (STM), and albedos and diameters
from the IRAS Asteroid Catalog. While the predicted fluxes have reasonable
correspondence to the fluxes we observed, we do not use these predictions
to generate our 160um calibration.
The "predictions" used for the calibration are based on either fitting the
24 and 70um photometry for objects, or extrapolating from 70um where we
only have data in that band. The fit or extrapolation is used to predict
the flux at the effective wavelength of the 160um band (156um).
Data Reduction
The data were reduced using the MIPS Data Analysis Tools (DAT). All
the data were post-processed using Karl Gordon's RED_PHOT package, which
cleans up the images considerably. RED_PHOT also produces
photometry automatically, and we used the RED_PHOT results at 24 and 70um.
At 160um we performed the photometry by hand, using me_phot (John
Stansberry). This was necessitated by the pointing issues at 160um,
mentioned above. Details of the conversion from instrumental units
to fluxes are presented in the following table. In addition to allowing
the user to select the placement of the photometric aperture, me_phot
uses a circular aperture to compute fluxes, rather than the approximate
circular aperture utilized for the RED_PHOT photometry. The aperture
corrections for the RED_PHOT photometry are small, and the apertures
very large relative to the pixel and PSF scales, so the approximation
to a circular aperture should be OK. The me_phot aperture correction
is huge (a 1.5 pixel object aperture was employed), but was derived
using the same methods as employed within me_phot. The uncertainty
in the 160um photometry due to the large aperture correction / small
object aperture is TBD.
|
Photometric Details of the Asteroid Calibration |
| Band | Cal. Factor# | Aper.Rad. (") | |
| (um) | (MJy/sr) | (uJy/"2/U+) | Obj., Sky-range | Ap.Corr. | Phot.Mthd. |
|
| 24 | 0.0446 | 1.05 | 35, 40 - 50 | 1.084 | red_phot |
| 70 | 700 | 16500 | 35, 39 - 65 | 1.185 | red_phot |
| 160 | 43* | 1000* | 24, 64 - 128 | 2.34 | me_phot |
|
| # Uncertanties assumed to be 5%, 10% and 20% at 24, 70, and 160um. |
| + U = DN/s at 24um, and is in dimensionless units for the Ge:Ga arrays. |
| * Previously determined 160um Calibration Factor. |
Results for All Observations
We present the results using all asteroid calibration observations here (i.e. combining
the results from the 3-color and 2-color samples). Results for the 2 subsamples are presented
further down, for those who may be interested.
Standard Thermal Model Fits
STM results are TBD, and will be presented in Figure 1.
Blackbody Fits
Figure 2 compares our measured 160um photometry of asteroids to our predicted
160um fluxes based on blackbody fits and extrapolations from 24 and 70um observations
of those objects. The figure also shows lines for the previously determined calibration
factor (1000 uJy/"2/U160), a fit to these data which is forced to pass
through the point [0,0], and a fit which is not constrained to pass through [0,0]. The
plot shows that the response of the detectors is linear over the flux range 0.1 - 3 Jy.
The formal uncertainties in the fitted slopes (i.e. the calibration factors) are about 1%,
so the differences in the calibration factors is significant. The formal uncertainties
on the intercept is 9 mJy, so the intecept is statistically consistent with zero. Here
the fits are performed (and data plotted) using just the measurement uncertainties for
the individual observations, rather than RSS'ing those with the 20% calibration uncertainty.
Below, figures and fits include that 20% calibration uncertainty. This method should be
more correct, but weights the observations of bright objects considerably more because
they are detected at high signal-to-noise.
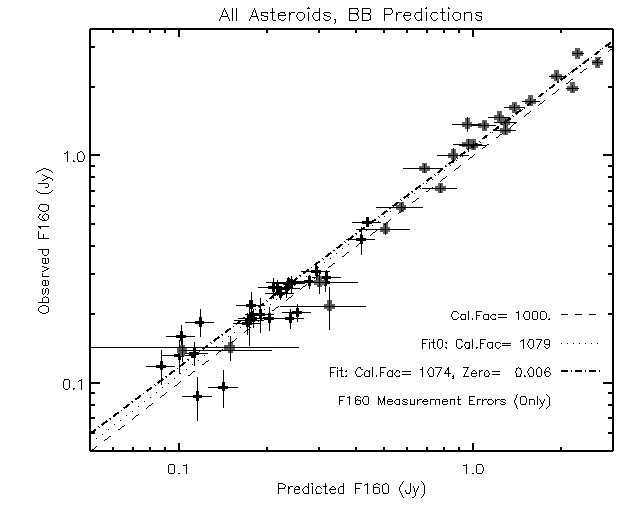 |
| Fig. 2 Observed 160um flux vs. predicted flux for 49
asteroids. The black plus signs show the data for objects with data at 24,
70 and 160um; the grey symbols are for objects observed only at 70 and
160um. The 3 lines are for the previously determined calibration factor
(dashed thin line), a fit to these data constrained to go through the
point F160 = P160 = 0 (dotted line), and an unconstrained fit to these
data (thick dash-dot line). Corresponding calibration factors are given
in the legend. The predicted fluxes are based on blackbody fits to the
24 and 70um data (for the 27 objects shown that have data at 24, 70 and
160um), and on extrapolation from 70um data (for the 22 brighter objects
with only 70 and 160um data). Derivation of the 70:160 color used for
the extrapolation is described in detail below.
|
Results for 3-color Observations
Blackbody Fits
We fit the observed 24 and 70um fluxes for 31 asteroid observations with blackbodies,
and used those fits to predict the 160um flux we should have observed. The figures
below summarize the results. We used the previously-determined 160um calibration factor of
1000 uJy/"2/U160 in constructing these plots. Figure 3 shows the
relationship between the observed and blackbody-predicted 160um fluxes. Lines show the
previously determined 160um calibration (see Table 1), and 2 linear fits to the data. One
fit includes the point F160 = P160 = 0 (labeled "Fit0" in the legend), and the other
does not include that point. The formal uncertainty in the slope is about 4%, and the
intecept is uncertain by about 10mJy, so both fits and the previously determined
calibration are consistent with one another, based on these data.
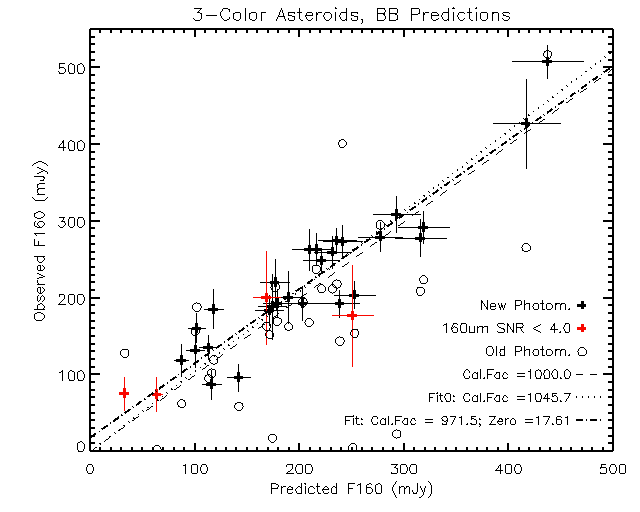 |
| Fig. 3 The observed 160um flux vs. the predicted flux
based on blackbody fits to the 24 and 70um data. Observations with low
SNR at 160um are in red. The photometry has recently been completely
re-reduced: previous values which have appeared in some slides are shown
as circles, and the newer, improved values as plusses. Observed flux
errors are computed as the RSS of the error determined from the image
and the 20% uncertainty on the previously determined calibration factor
(1000 uJy/"2/U160). Errors on the predicted flux are
determined by fitting blackbodies to the 0.7-sigma deviant observed flux
values, and using those blackbodies to predict the range of 160um fluxes
that are consistent with the shorter-wavelength observations. Linear
fits to the data plotted in black give a calibration factor of
1050 uJy/"2/U160 if the point [0,0] is included,
and a factor of 972 uJy/"2/U160 if it isn't
included. |
Figure 4 presents the same data as Figure 3, but as the observed/predicted
flux ratio. The significant improvment made in the recent re-reduction of all the
data is quite noticeable as the tighter clustering of the plus symbols relative to
that of the open circles.
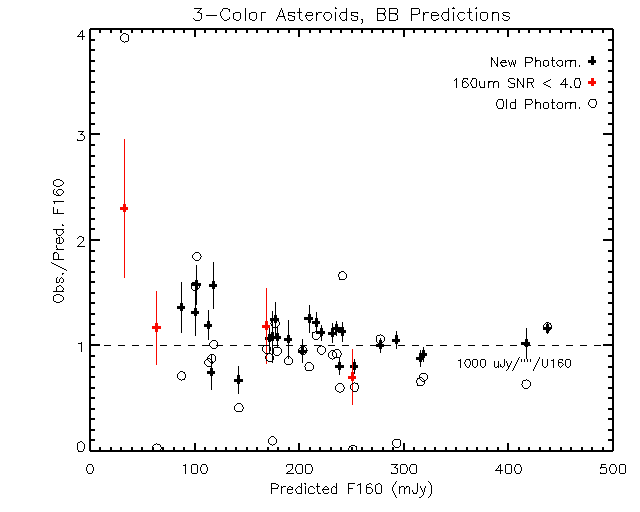 |
| Fig. 4 The ratio of observed to predicted 160um flux based
on blackbody fits to the 24 and 70um data. Observations with low
SNR at 160um are in red. Basically the same as Figure 3. Circles reflect
old photometry results. Plusses give the results based on the newer,
completely re-reduced photometry. |
Figures 5 & 6 provide the basis for extending the calibration to
brighter objects. Figure 5 shows the blackbody temperatures derived from our fits to
the 24 and 70um photometry. The temperatures of all the asteroids observed at 24
and 70um are clustered around 266 K, with a range of only 240 - 300 K. Because both
the 70 and 160um bands are well longward of the blackbody peak of even the warmest
asteroid we've observed (at 230 K the blackbody peak is as 22um), the variation in
temperature seen in this figure does not result in very much variation in the
70um to 160um color.
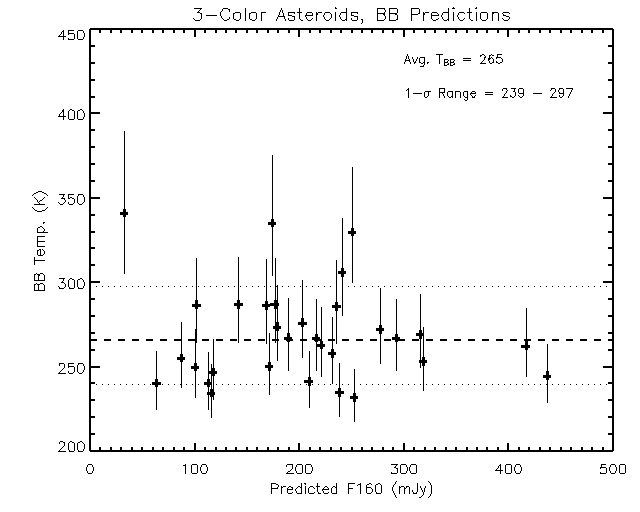 |
| Fig. 5 Blackbody temperatures based on our fits to the 24 and 70um
photometry for 31 asteroid observations. The error bars are the range computed by
using the 0.7-sigma deviant 24 and 70um fluxes, and fitting blackbodies to those.
The errors are dominated by the 10% uncertainty in the 70um absolute calibration.
The legend gives the weighted-average blackbody temperature, and the 1-sigma range.
Horizontal lines across the plot display those same values. |
Figure 6 shows the ratio of our measured 70um flux to the predicted 160um
flux for all asteroids observed at 24 and 70um. The error bars on individual
measuremnts are large relative to the scatter of the points, probably indicating
that we over-estimate the uncertainty on our predicted 160um fluxes. The scatter
of the individual determinations indicates a 1-sigma uncertainty in the 70 to
160um color of 0.092. This translates into an uncertainty on 160um fluxes predicted
solely by extrapolation from 70um of 2.4%. When RSS'd with the 10% uncertainty in the
absolute calibration at 70um, we can use a 70um observation (alone) to predict the
160um flux of an asteroid to better than 11%. This is a significant improvement over
the uncertainty on the 160um calibration (20%) that we are currently carrying.
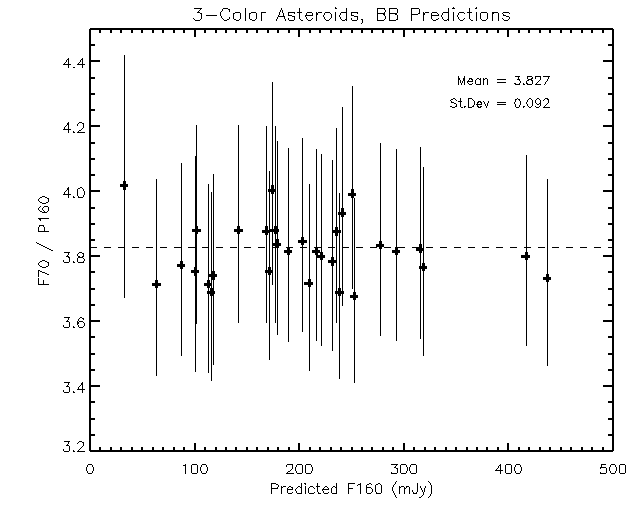 |
| Fig. 6 Asteroid 70um to 160um color derived from our blackbody
fits to the 24 and 70um observations. The error bars include the uncertainties
in the measured 70um fluxes and those on the predicted 160um fluxes (see caption
to Fig. 5). Based on these 31 asteroids, the 1-sigma variation in the 70 to 160um
color is 0.092.
|
Results for 2-color Observations
Blackbody Fits
About half of the asteroids we observed have only 70 and 160um
data, because they would have saturated the 24um array. For these
2-color targets, we use the 70 to 160um color derived above to
predict thier 160um flux. As noted earlier, the uncertainty in that
color due to variations in the temperature of asteroids is only about
2.4%. Figure 7 shows our results for the 27 2-color targets.
These data indicate that a small upward revision of the 160um calibration
factor may be called for. When the data are fit with a line constrained
to pass through the point [0,0] the resulting calibration factor is
1108 uJy/"2/U160, whereas without that constraint the
factor is 1139 uJy/"2/U160. The formal uncertainties in
these calibration factors are about 5%, based on these data. The fits
exclude 6 observations which had low SNR, or where the measured 160um
flux deviates from the predicted flux by more than 50%. These deviant
points (in red in figure 5) all lie well above the trend indicated by
all the other data. The reason for these departures is TBD, although
the predicted flux for the 2 brightest targets are flirting with the
3Jy 160um saturation limit.
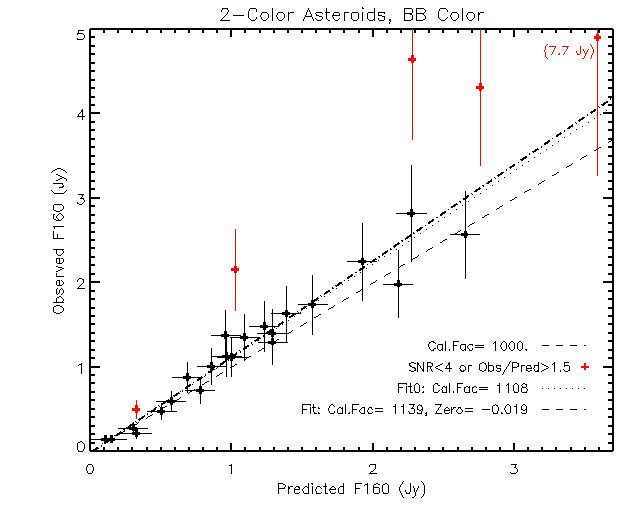 |
| Fig. 7 Observed vs. predicted 160um flux for asteroids
observed only at 70 and 160um. Most are brighter than those in the
3-color sample, although a few faint ones were observed this way
early in the calibration program. Errors on the observed flux are
computed as the RSS of the error determined from the image and the
20% uncertainty on the previously determined calibration factor
(1000 uJy/"2/U160). Errors on the predicted flux
are the RSS of the uncertainty in the observed 70um flux (including
its 10% absolute calibration uncertainty) and the uncertainty in
the 70 to 160um color computed from the 3-color asteroid sample.
Linear fits to the data plotted in black give a calibration factor of
1108 uJy/"2/U160 if the point [0,0] is included, and a
factor of 1139 uJy/"2/U160 if it isn't included.
|


