Figure 1: Asteroids
Principal:
Deputy:
Analyst:
AORKEYS:
Last Updated:
The campaign 3 and 4 data were processed with version 2.70 of the DAT, turning off the electronic nonlinearity correction and using the flight calibration files, while the campaign 7 data were processed similarly using version 2.73 of the DAT.
| Table 1: Data Used | ||
| AORKEY | OBJECT | TYPE |
| 8811776 | Ampella | asteroid |
| 8812032 | Beatrix | asteroid |
| 8812288 | Tercidina | asteroid |
| 9065984 | Tercidina | asteroid |
| 8809728 | HD 163588 | K2 III |
| 8819456 | HD 163588 | K2 III |
| 8937728 | HD 163588 | K2 III |
| 9067264 | HD 163588 | K2 III |
| 9060608 | HD 36673 (Arneb) | F0 Ib |
| 9652736 | HD 87901 (Regulus) | B7 V |
The data from campaigns 3 and 4 were processed in such a way as to make images of identical size, in which the target should always appear at the same position on the array. This was done as follows: I used mips_enhancer to make 3 images: one asteroid, one K giant, and one hot star. The flags used were -RR, -s 0.5, and -l. I used identical offset lists (derived from the hot star data, although the lists would have been similar for any of the data sets) for all the data sets. The median value of the image on the half of the array that does not contain the source was assumed to represent the background and was subtracted from all the mosaics. In Figure 1, I show the average of the asteroid data - these data show no leak contribution. In Figure 2, I show the average of 4 observations of HD163588, a K2III star that is the MIPS routine standard at 70µm and which has also been monitored at 160µm as a stability check. These data are dominated by the blue leak. In Figure 3, I show the only hot star we had detected at 160µm at a high S/N ratio by campaign 4. These data also show the leak.
Figure 1: Asteroids
Figure 2: Cool star (K2III)
Figure 3: Hot star (F0Ib)
I attempted to isolate the leak contribution by subtracting scaled copies of the asteroid image from the stellar images. I determined the scale factor in two ways: One method was to choose by eye the scale factor which left residuals around the leak which appeared to match the noise level in the image. The other approach was to assume that a properly-subtracted red source would leave no pixel values lower than the lowest values found elsewhere in the image at the same radius from the leak. (The separation was about 5 pixels in these images). The scale factor determined by both these methods for HD 163588 was similar, about 0.06, and I estimated that this factor was known to about 30% by comparing the optimal value to the largest plausible scale factor measured in the by-eye comparison. The ratio of leak to photosphere measured in this fashion was 17±5 for HD 36673 and 14±4 for HD 163588. Examples of the subtraction can be found in Figure 4. The optimal subtracted image of HD 163588 is shown at a larger scale in Figure 5. This image should contain only the leak, and the image appears more symmetric than the image shown in Figure 2, which still contains the photosphere.


Figure 4: Example red-source subtractions
for HD 163588. The scale factors are evenly spaced from -3 sigma to +3
sigma.
Figure 5: Leak only, cool star
After isolating the leak, I subtracted it from the HD 163588 image and compared the leak flux to the photosphere flux. I performed photometry on the leak-subtracted cool star to determine the calibration factor. The photometry was performed very simply with IRAF's "imexam" task. I measured the flux in an aperture with a 13-pixel radius (on an image which had been subsampled by a factor of 2 - the equivalent aperture at the native pixel scale is 6.5 pixels) and used no background annulus because the background had already been subtracted from the image. The aperture was large enough to contain the first bright ring of the PSF. The measured counts were ~1.08 MIPS160Unit, and I applied an aperture correction of 1.12 (measured using a TinyTim simulated PSF) to compute a total flux of 1.21. The predicted flux of HD 163588 at 160µm is 6.88e-2Jy, and the pixel size is ~8 arcseconds, so the calibration factor is 6.88e4µJy/8²/1.21 = 888±266µJy/(sq.arcsec.)/MIPS160Unit, assuming the error is dominated by uncertainties in the leak subtraction. This can be compared to the canonical value (derived from asteroid data) of 977.
An independent analysis by K. Su of one observation of HD 163588 and the asteroid Tercidina resulted in a leak-to-photosphere ratio of ~8 and a calibration factor of 628µJy/(sq.arcsec.)/MIPS160Unit. This analysis used 1-D profile plots to determine the correct scale factor, as shown in Figure 6.
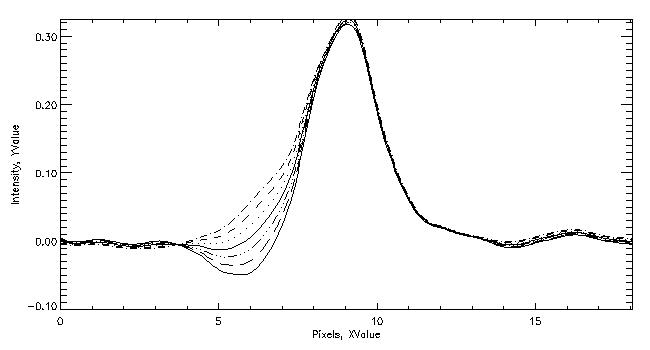
Figure 6: 1_D cut along a row of the
HD 163588 image, showing the profile after subtraction of the asteroid
Tercidina scaled by evenly-spaced factors ranging from 0 to 0.3. The solid
line represents the best scale factor. Contributed by K. Su.
A 3×3 raster map of the star Regulus was performed in campaign 7. These data contain many dither positions and are thus suitable for high-resolution processing. J. Cadien processed these data with both MEM and HIRES. The mips_enhancer, MEM, and HIRES images are shown in Figures 7, 8, and 9, respectively. Note that the non-rotated images have a left-right orientation opposite the images presented above, while the HIRES image is in sky coordinates with N up and E to the left. The leak is to the left (and slightly below in the HIRES image) of the photosphere in these data.
Figure 7: Mips_enhancer image of
Regulus.
Figure 8: MEM image of
Regulus.
Figure 9: HIRES image of
Regulus.
The HIRES image appeared to have the highest resolution of the images here, so we attemped to subtract the bar artifacts that cut across the center of the image at an angle of 24 degrees. The resulting image is shown in Figure 10. The photosphere is barely visible above and to the right of the dominant leak image. Attempts to perform photometry comparing the photosphere and leak resulted in a range of leak to photosphere ratios of 10 to 30.
Figure 10: HIRES image of
Regulus, with some artifacts removed.
The contribution of the 160µm spectral leak to stellar images was measured in two ways: by subtracting images of red sources from images of stars and by applying high-resolution processing with MEM and HIRES to dithered observations of a star. The artifacts from the high-resolution processing are comparable to the photosphere signal and thus the results are fairly uncertain. We weight the red source subtraction results more heavily and find that the leak to photosphere ratio at 160µm is 15±7.
none