Figure 1. 24 µm slope image. All values are zero except for two bad (low-response) pixels.
Principal:
Deputy:
Analyst:
AORKEYS:
Last Updated:
All data were processed with the DAT in order to derive calibrated images. Images would normally be combined with mips_enhancer, but as all the data in this case are saturated, this step was neglected. Unprocessed ramps for the Ge arrays were inspected for unsaturated reads at the beginning of each ramp.
24 micron SUR slopes and first differences (Figures 1 and 2) are all zero, with the exception of two typically bad pixels. Thus, the array was saturated in less than 0.5 seconds. One exposure of raw-mode data was taken for mips-915, CE State Validation and Functional Test. In those data the first read after the 2 bias boost frames (the reset-read frame) showed the normal patterns and DN levels for such data, confirming that the 24 µm array is alive.
Figure 1. 24 µm slope image.
All values are zero except for two bad (low-response) pixels.

Figure 2. 24 µm first difference
image. All values are zero except for one bad (low-response) pixel.
Data ramps on the 70 µm array saturate at the first read for most pixels, but are unsaturated on the first read for a few. Figure 3 shows two 70µm images which indicate the degree of saturation of each pixel at the first read after the reset at the beginning of the DCE. Because all pixels on the the array are reset simultaneously, but pixels are read-out sequentially thereafter, the effective integration time for the first read depends on the order in which the pixels are read-out, and ranges from 1/8th to 1/4 of a MIPS second.
Figure 3. 70 µm slope images
derived from the difference between the first and second reads on the data
ramps, displayed with an inverted greyscale (i.e. dark is high slope, light
is 0 slope). The two frames were acquired while the CSMM was deflected to
the 70 µm "Dark A" position (left), and the 160 µm Dark position
(right), which places the 70 µm array in almost exactly the nominal
SED mode position. Saturated pixels show zero slope and are white; unsaturated
pixels appear dark, with the darkest pixels being those that were least
saturated at the first read. The readout order of the pixels is indicated
by the labels on the right-hand image.
Based on the above supposition that some of the pixels were not saturated on the first read after the reset, several interesting features are apparent in Figure 3:
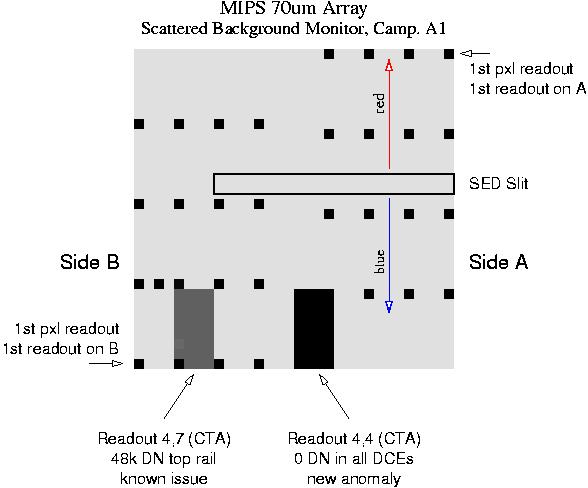
Figures 4 and 5 show raw images of the DN at the first read for the 70µm array, and correspond to the left and right panels in Figure 3. Saturated pixels are white, unsaturated ones are darker. Visible in this representation are readout [4,7] (medium grey 4x8 block, DN = 48k, at lower left), which developed a short to chasis ground during ATLO testing, and readout [4,4] (black 4x8 block, DN = 0, bottom middle), which has developed a short, probably on its output line, after launch.

Figure 4. 70 µm first-read DN image for an exposure taken at the 70 µm Dark A position.

Figure 5. 70 µm first-read DN image for an exposure taken at the 70 µm SED position (CSMM was configured for 160 µm dark, which is almost identical to SED nominal for the 70 µm array).
The figure below summarizes out preliminary conclusions about the 70 µm array. It should be straight-forward to confirm or discount the more preliminary of them by comparing with Scatttered Background Monitor data from Campaign B.
Figure 6 shows the DN at the first read, and uses unaltered MIPL output such that high saturation occurs at -1DN, rather than at 65k DN. In the particular case of the 160 µm array the unaltered MIPL DN show readouts 3 and 5 more clearly, because readout 3 rails at about +18k DN, and readout 5 rails at about -600 DN. The 16 engineering pixels occupy the center row in the image, with pixels 3, 8, 13, and 18 being empty.

Figure 6. 160 µm first-read image. All DN values are -1 except for the two shorted readouts in the bottom row. Readout 3 DN are about +18k, reflecting a DC offset of the data ramp by -48k; Readout 5 DN are about -600 DN, reflecting a tiny DC offset. Both offsets are caused by thermally activated shorts on the ground-sense lines for these readouts.