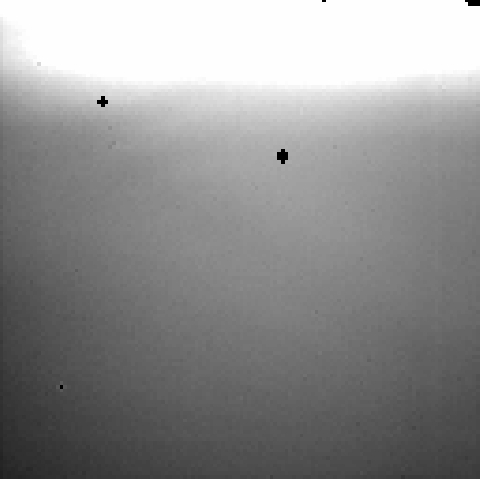
Figure 1. Calibrated 24 µm slope image. Data values range from ~10,000-60,000 DN/s. Bad pixels have been masked out.
Principal:
Deputy:
Analyst:
AORKEYS:
Last Updated:
All data were processed with the DAT in order to derive calibrated images. Images would normally be combined with mips_enhancer, but as the header pointing information is erroneous, and much of the data are saturated, this step was neglected. Unprocessed ramps for the Ge arrays were inspected for unsaturated reads at the beginning of each ramp.
The unprocessed images show nonzero data for both the slope and first difference image planes, indicating that the data ramps were saturated sometime after the first few reads. Figure 1 shows a typical calibrated DCE. The scattered background radiation uniformly illuminates the array, with a strong gradient from top to bottom varying by up to a factor of 6. The median count rate is ~25,000 DN/s, or ~2000 MJy/sr (using the radiometric model predicted conversion). Images at the 70 µm dark positions are saturated in both the slope and first difference plane, indicating that the sky flux levels are still well above the saturation point.
Figure 1. Calibrated 24 µm
slope image. Data values range from ~10,000-60,000 DN/s. Bad pixels
have been masked out.
Figure 2 shows the trend of signal versus DCE # for a typical pixel. The calibrated slopes are systematically ~3% lower at each DCE containing a bias boost, similar to behavior seen in ground testing. Ignoring the boost DCEs, the standard deviation in the signal is less than 1%, consistent with photon noise statistics. An overall trend of decreasing signal with time is also seen, at about a 1% level (~2% in the array mean) over the total time of the observation, roughly 4.5 minutes. Since these data were taken about 30 minutes after the thermal anneal, this behavior may be related to the usual small decline in responsivity seen in the ~45 minutes after each anneal, although the trend in the present data is steeper by about a factor of 2 than that seen on the ground.
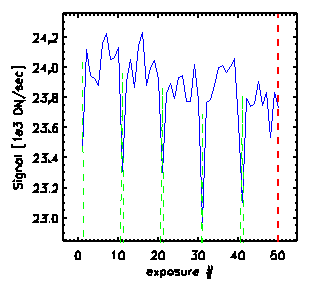
Figure 2. Calibrated 24 µm
slopes (blue line) for a typical pixel (70,70) as a function of DCE.
The 70 µm array remains saturated, though an increasing number of pixels are unsaturated in the first read compared to the data from Campaign A. Figure 3 shows images of the 2-point differences between the first and second samples, at both the 70 µm dark and 160 µm dark/SED mode mirror positions. A significant portion of the array is unsaturated at the first read for the latter position, consistent with the results from the previous campaign.

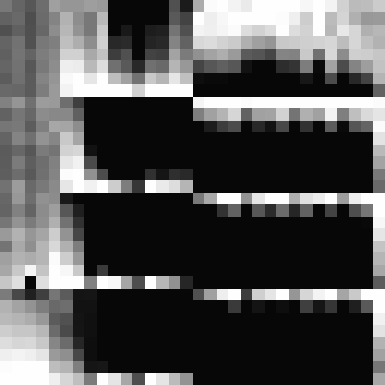
Figure 3. 70 µm 2-point difference images at the
70 µm dark A position (left) and the 160 µm dark/SED mode
position (right). Values range from 0 to ~60,000 DN.
The 160 µm array is still completely saturated, as seen in Figure 4.

Figure 4. 160 µm dark
image of counts at the first read. All pixels are pegged at
the 65536 DN saturation level, except for readout 3, where the values
are ~20000 DN, and readout 5, with values ~65000 DN, reflecting DC offsets
similar to those seen in Campaign A.