

Figure 1. (left) Calibrated 24 µm slope image for one DCE. (right) Coaddition of all 50 DCEs. Data values range from ~500-2500 DN/s. Bad pixels have been masked out.
Principal:
Deputy:
Analyst:
AORKEYS:
Last Updated:
All data were processed with the DAT in order to derive calibrated images. The 24 micron images were coadded using mips_enhancer with the dark flag turned on - the reconstructed pointing still does not work, so IER-derived images do not yet have the correct pointing information in the headers. Unprocessed ramps for the Ge arrays were inspected for unsaturated reads at the beginning of each ramp. However, a few pixels now have enough unsaturated reads for a slope to be fit.
The data are fully unsaturated for the first time! Figure 1 shows a typical calibrated DCE, along with the coadded image of all 50 DCEs in the observation (combined with mips_enhancer). We see cosmic ray hits for the first time, with a frequency of ~10 per DCE. Note how well the coaddition with mips_enhancer (using default parameters) removes all cosmic ray hits. The scattered thermal background radiation still dominates, with the same gradient as seen in Campaign B, varying by up to a factor of 5 over the entire array. The median count rate is ~1000 DN/s, or ~80 MJy/sr (using the radiometric model predicted conversion). Images at the 70 µm dark positions are saturated in both the slope and first difference plane, indicating that the sky flux levels are still well above the saturation point.
Figure 1. (left) Calibrated 24 µm slope image for one DCE.
(right) Coaddition of all 50 DCEs. Data values range from ~500-2500 DN/s.
Bad pixels have been masked out.
Figure 2 shows the trend of signal versus DCE # for a typical pixel. The standard deviation in the signal is roughly a few percent, consistent with photon noise statistics. There is still a gradient of decreasing signal with time, especially within the first ~10 DCEs, which is similar to the behavior first seen in Campaign B. This is somewhat correlated with the array temperature, which is fairly stable (changing within ~0.002 K) after the first ~10 DCEs, but is systematically lower by ~0.006 K during the first few DCEs.
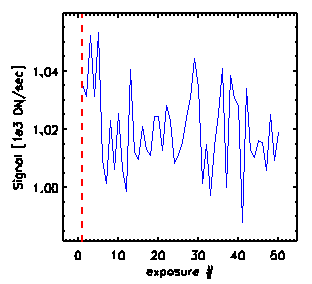
Figure 2. Calibrated 24 µm
slopes (blue line) for a typical pixel (70,70) as a function of DCE.
The 70 µm array remains saturated, though an increasing number of pixels are unsaturated in the first read compared to the data from Campaign B. Figure 3 shows images of the 2-point differences between the first and second samples, at both the 70 µm dark and 160 µm dark/SED mode mirror positions. A significant portion of the array is unsaturated at the first read for the latter position, consistent with the results from the previous campaign. A small percentage of the pixels now have up to 5 unsaturated reads. Slope images should be coming soon!
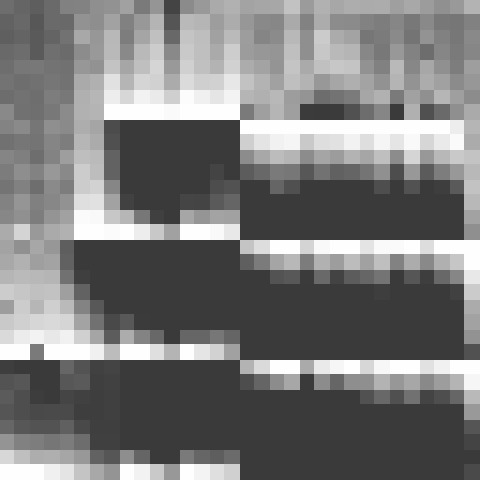
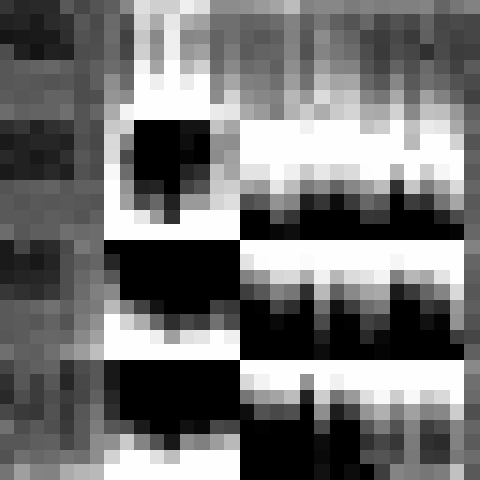
Figure 3. 70 µm 2-point difference images at the
70 µm dark A position (left) and the 160 µm dark/SED mode
position (right). Values range from 0 to ~60,000 DN.
The 160 µm array is still completely saturated, as seen in Figure 4.

Figure 4. 160 µm dark
image of counts at the first read. All pixels are pegged at
the 65536 DN saturation level, except for readout 3, where the values
are ~20000 DN, and readout 5, with values ~65000 DN, reflecting DC offsets
similar to those seen in Campaign A.