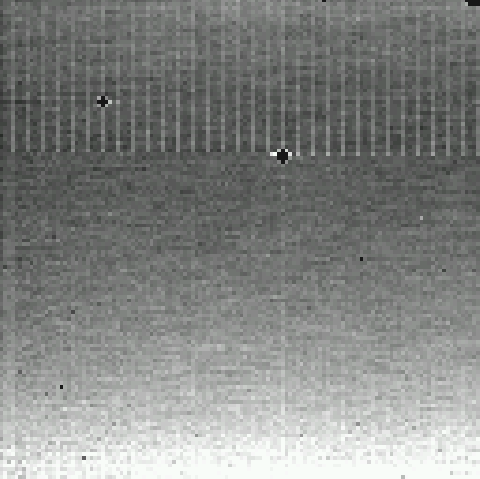
Figure 1. Coadded 24 µm dark image (not including bias boost DCEs). Data values range from ~3-15 DN/s. Bad pixels have been masked out.
Principal:
Deputy:
Analyst:
AORKEYS:
Last Updated:
All data were processed with DAT version 2.15 in order to derive calibrated images. The 24 micron images were coadded using mips_enhancer with the dark flag turned on - the reconstructed pointing still does not work, so IER-derived images do not yet have the correct pointing information in the headers. Slopes can now be fit to roughly 50-70% of all pixels at 70 microns, though almost all ramps are saturated. Unprocessed ramps for 160 micron array were inspected for unsaturated reads at the beginning of each ramp; all pixels are still saturated at the first read.
The 24 µm dark is getting quite dark! Figure 1 shows the calibrated, coadded image of all 50 DCEs in the observation (combined with mips_enhancer). Mean counts are ~7.5 DN/s, or ~0.33 MJy/sr using the new throughput estimate from the first light observations. The scattered thermal background radiation is now of comparable brightness to absolute dark levels measured on the ground. Figure 2 shows the on-orbit image subtracted by a 3-second SUR dark image taken during CTA testing. The striping pattern and apparent amplifier glow at the bottom of the array are cleanly subtracted, leaving just the pure scattered thermal background, with mean counts ~3.6 DN/s (0.16 MJy/sr); the illumination pattern of this image is consistent with the scattered background images from Campaigns B & C. The remarkably low brightness levels indicate that we may actually obtain true darks on orbit once the telescope completely cools (and perhaps as early as the next campaign). However, the stability of the dark apparent in the subtraction performed above also indicates that we could confidently use ground darks throughout operations if the scattered light component does not completely fade.
Figure 1. Coadded 24 µm dark image (not including bias boost
DCEs). Data values range from ~3-15 DN/s.
Bad pixels have been masked out.

Figure 2. 24 µm residual scattered thermal background image;
the coadded image shown in Fig. 1 has been subtracted by a dark image
with the same exposure time obtained on the ground. Data values range
from ~2-8 DN/s.
By comparing the residual scattered background counts to the sky
counts measured during this campaign, the dark
mirror position attenuation factor can be estimated.
The dark sky position has not been observed (this will be done
in the ultimate scattered light level task in Campaign R), so the flat field
pointings were used instead, scaled by the ratio of the predicted
sky backgrounds of the dark and flat positions (13 and 34 MJy/sr,
respectively, as estimated with Spot). The resulting sky-to-dark
illumination ratio is approximately 300, consistent with measurements
taken during LBTC testing. Thus, once the thermal background
becomes negligible, scattered light at the 24 micron dark position
should be roughly 0.04 MJy/sr, or ~1 DN/s, smaller than the dark current.
The 70 µm array remains saturated, though on scale at the first few reads at both dark positions. A significant number of pixels have more than 5 unsaturated reads, allowing slopes to be fit; slope images at the 70 µm and SED dark positions are shown in Figure 3, while 2-pt difference images are shown in Figure 4. The 70 dark A and SED positions are clearly the darkest, as expected.
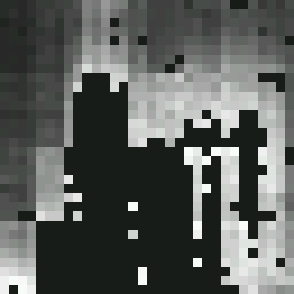

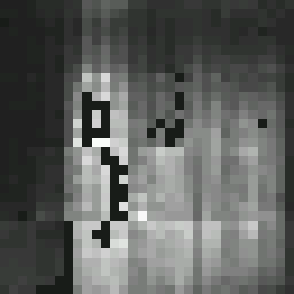
Figure 3. 70 µm slope images at the 70 µm dark A
position (left), dark B position (middle) and the 160 µm dark/SED mode
position (right). Values range from 0 to ~60,000 DN.
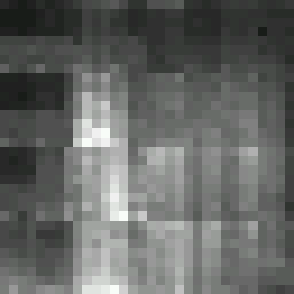
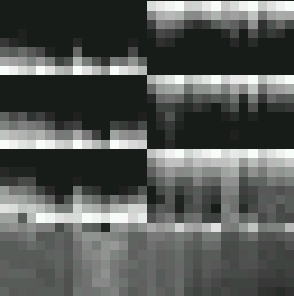
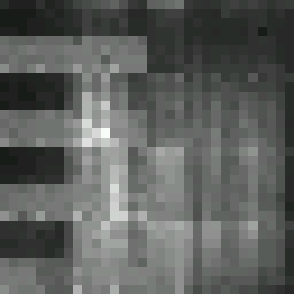
Figure 4. 70 µm 2 pt. difference images at the 70 µm dark A
position (left), dark B position (middle) and the 160 µm dark/SED mode
position (right). Values range from 0 to ~60,000 DN.
The 160 µm array could not be packed due to problems with the pipeline. Based on inspection of MIPL data, the array is still completely saturated