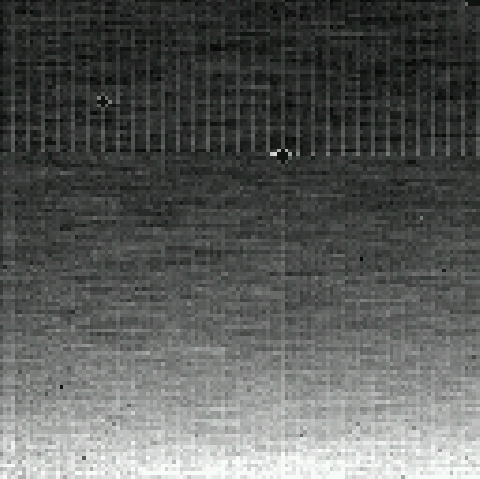
Figure 1. Coadded 24 µm dark image (not including bias boost DCEs). Data values range from ~ 0 to 15 DN/s. Bad pixels have been masked out.
Principal:
Deputy:
Analyst:
AORKEYS:
Last Updated:
All data were processed with DAT version 2.15 in order to derive calibrated images. The 24 micron images were coadded using mips_enhancer with the dark flag turned on - the reconstructed pointing still does not work, so IER-derived images do not yet have the correct pointing information in the headers. Slopes can now be fit to roughly 50-70% of all pixels at 70 microns, though almost all ramps are saturated. Unprocessed ramps for 160 micron array were inspected for unsaturated reads at the beginning of each ramp; all pixels are still saturated at the first read.
The 24 µm dark is getting quite dark! Figure 1 shows the calibrated, coadded image of all 50 DCEs in the observation (combined with mips_enhancer). Mean counts are ~4.5 DN/s (this is probably artificially inflated due to larger slopes in the bottom part of the array; see the MIPS-190 report). Figure 2 shows the on-orbit image subtracted by a 3-second SUR dark image taken during CTA testing. The mean counts are ~0.6 DN/s, and there is no evidence of the scattered light pattern evident in previous campaigns; thus, the scattered thermal background component is probably negligible.
Figure 1. Coadded 24 µm dark image (not including bias boost
DCEs). Data values range from ~ 0 to 15 DN/s.
Bad pixels have been masked out.

Figure 2. 24 µm residual scattered thermal background image;
the coadded image shown in Fig. 1 has been subtracted by a dark image
with the same exposure time obtained on the ground. Data values range
from ~ -3 to 4 DN/s.
The 70 µm array is getting less saturated, especially at the 70 dark A and 160 dark mirror positions. Slope images for these positions and the 70 dark B position are shown in Figure 3. Mean slopes at the 70 dark A position are ~ 47,000 DN/s.
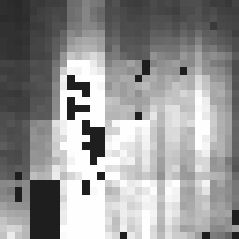

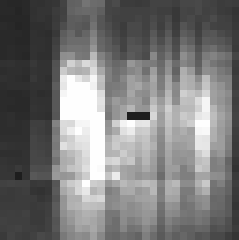
Figure 3. 70 µm slope images at the 70 µm dark A
position (left), dark B position (middle) and the 160 µm dark/SED mode
position (right). Values range from 0 (saturated) to ~110,000 DN/s.
The 160 µm array could not be packed due to problems with the pipeline. It is probably still fully saturated.