Contact Stansberry - "; echo " there is a problem w/ your write-up.\n"; return ; } $row = mysql_fetch_array($result); $title = $row["title"]; $princ = $row["principal"]; $deputy= $row["deputy"]; $campn0 = $row["campn0"]; $aorkeys = $row["aorkeys"]; // get real name of principal, deputies $princ = ioc_get_person($princ); $princ = $princ[0]; $deps = explode(",",$deputy); foreach ($deps as $depty) { $depty = trim($depty); $depty = ioc_get_person($depty); $depty = $depty[0]; $depty = explode(",",$depty); $depty = $depty[0]; // last names only $deplist[] = $depty; } $deplist = implode(", ", $deplist); $caid = sprintf("%03d",$caid); $file = "mips-".$caid.$campn.".analysis.php"; // END PHP. ?> <? echo "MIPS-$caid, Campaign $campn IOC/SV Analysis"; ?>

Principal:
Deputy:
Analyst:
AORKEYS:
Last Updated:


Task Outcome Summary


Abstract

This task collects 2, 10-DCE RAW exposures, one just before and one just after a 24 µm thermal anneal. Diagnostic data is collected during the anneal to monitor instrument temperatures. The task then performs the state transitions Observe --> Ready --> Operate (i.e. MIPS off), and then Operate --> Boot --> Off. The succesful completion of the transition is confirmed by the lack of any unexpected errors during the state transition.
NOTE: The mips-900 IER in this campaign fails to return the offset voltage on the 24 µm array to the correct setting after the thermal anneal. As a result, the DN in the reset-read frame after the anneal is at around -12000 DN, rather than around -31000 DN as it should be. This problem should be corrected by Campaign D1.

Analysis

The diagnostic dumps from the thermal anneal are translated into temperatures and plotted for comparison with other anneals, and to verify operation of the anneal heater. DN images from the reset-read frames of the 2 RAW exposures are examined and compared to determine if the anneal changed the response of the array in any way (see NOTE in Abstract, however). Succesful completion of the state transitions is confirmed by the lack of any errors.

Results

Tepmerature Plots from Anneal

The temperature plots are presented in the analysis for mips-900 in this campaign, and can be seen here. The temperature behavior during the anneal was nominal.

24 µm Images

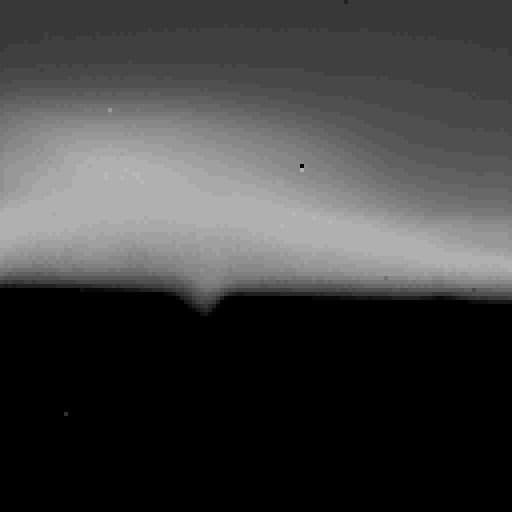
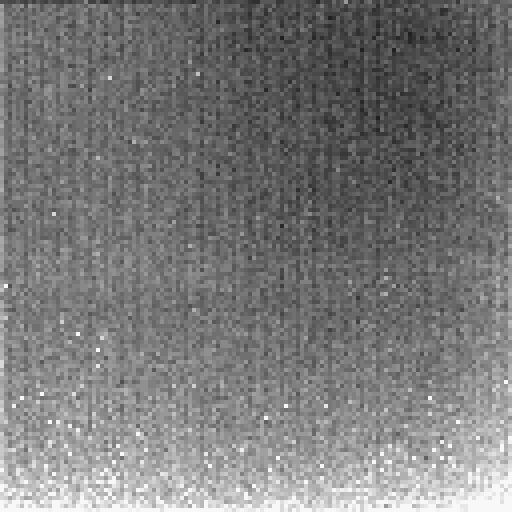
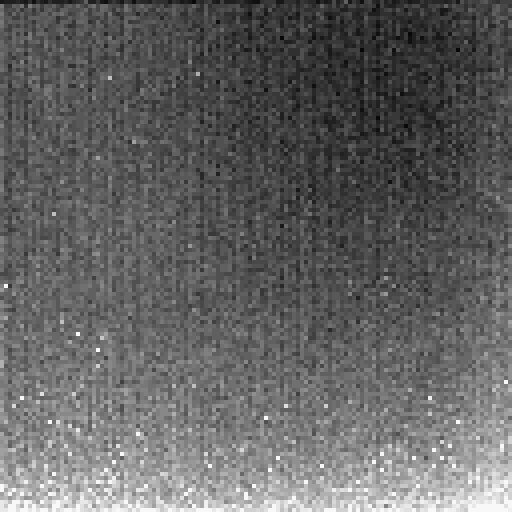
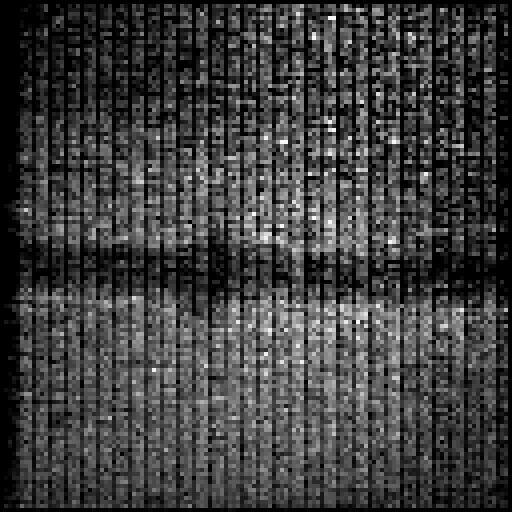
The figure below shows DN images from the reset-read frame from the 3rd DCE of the RAW exposures taken before and after the thermal anneal (see mips-990_24um.pro). The images have been scaled linearly from 0 - 5000 DN, and are extremely similar in their structure. It should be noted that a constant value of 19429 DN were subtracted from the data from after the anneal, because of the problem with the offset voltage noted in the abstract. Figure 3 shows the ratio of the after-anneal image to the before-anneal image. The dark bar across the image is due to a latent image of the pickoff-mirror edge, which was serendipitously being imaged in the final exposure sequence of mips-950 (CSMM was at the 160 µm dark position, which directs the 24 µm array at one edge of the pickoff mirror - see Figure 4). It is interesting that the latent, which is present in the reset-read frame of the RAW exposures, is present only in the region where the light was bright but unsaturating. There is also some evidence that this latent decays with a slower timescale than the latents in the slope images. For example, ratioing the reset-read frame from DCEs 2 and 10 of the before-anneal data does not show the latent visible in Figure 3.


Figure 1.DN image from the reset-read frame of the 24 µm RAW exposure taken before the thermal anneal on the Si array. Scaling is 0 - 5000 DN.


Figure 2.DN image from the reset-read frame of the 24 µm RAW exposure taken after the thermal anneal, same scaling as above.


Figure 3.Ratio of the image in Fig. 2 to Fig. 1 showing the latent from the pickoff-mirror edge.


Figure 4.Slope image (SUR) from the scattered background test in Campaign C, where the images were much less saturated, and the pickoff-mirror edge is visible. The latent artifact visible in Figure 3 coincides with the edge of the pickoff-mirror in this image, which would be in the same place as in the Campaign B data. NOTE that the bottom of the image is saturated (0 slope), and the light seen in the upper part of the image is scattered light (the notch in the pickoff mirror points into the mirror, i.e. into the more brightly illuminated part).
Conclusions

The thermal anneal on the 24 µm array worked correctly, but an error in the IER failed to return the offset voltages on that array to their correct value after the anneal, resulting in data ramps starting ~19000 DN higher than they should. The problem will be corrected by Campaign D1. The thermal anneal cleaned-out the latent image. It is not currently known if the presence of a latent in the reset-read frame impacts the calibration of the 24 µm data. To first order things should be OK because everything is done with slopes, but this might have some subtle interaction with droop or latent image correction.

Output and Deliverable Products

None.

Actions Following Analysis

None.