Principal:
Deputy:
Analyst:
AORKEYS:
Last Updated:
We converted the diagnostic data from the thermal anneal into temperatures and generated temperature plots. These data are compared to the temperature curves from previous anneals. These data are presented in the metatask writeup mips-2050.
We compared the RAW data taken before and after the thermal anneal to look for changes in array behavior. The items of interest were the ramp starting points, the noise levels on the detectors, and the responsivity patterns. The ramp starting point data are presented in the metatask writeup mips-2060.
The data were reduced using mips_sloper with no flags. The PreFlight dark, flat, droop correction, bad pixel mask, and linearity corrections were used. We used the IRAF task qphot with an extraction radius of 6 pixels, with a sky annulus of inner radius 8 pixels and width 5 pixels. This gave us measurements of the mean sky level and of the sky-subtracted flux within the extraction radius. These results are presented below.
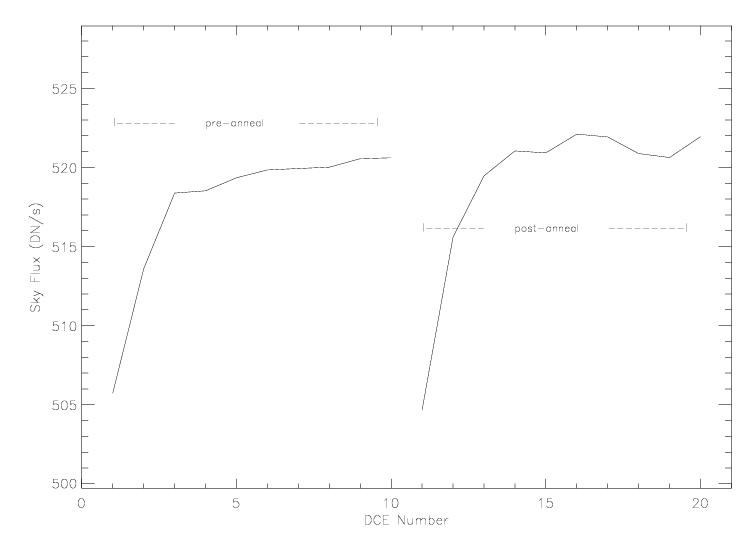
filename:  mips_IER_7110912_pht_A24_Pukn_pos-1_4s.red.fits
DCE MeanSky    SkyDev   Rad    Sum         Area    SkySubFlux
 1  505.7257  22.75022 6.00  347701.4   113.1562   290475.4
 2  513.5912  21.78249 6.00  353320.7   113.1725   295196.3
 3  518.3794  22.49594 6.00  353669.3   113.1705   295004.1
 4  518.5238  20.26164 6.00  353500.7   113.1924   294807.8
 5  519.3474  21.49579 6.00  353061.2   113.2096   294266.1
 6  519.8422  21.77713 6.00  353203.9   113.2008   294357.3
 7  519.9327  21.80017 6.00  352247.8   113.2077   293387.4
 8  520.0168  22.05951 6.00  352550.5   113.218    293675.2
 9  520.5536  22.0038  6.00  352172.8   113.1901   293251.3
10  520.6093  20.84022 6.00  352733.3   113.1896   293805.7
--- Thermal Anneal happened here ---
11  504.6711  23.46998 6.00  344302.3   113.2532   287146.6
12  515.5959  21.63516 6.00  351604.9   113.2493   293214.1
13  519.4681  21.68307 6.00  353668.6   113.271    294827.9
14  521.0444  22.10491 6.00  353621.5   113.2743   294600.5
15  520.9221  21.78965 6.00  353217.6   113.2715   294211.9
16  522.1057  21.43302 6.00  352607.8   113.2813   293463.
17  521.9291  23.35706 6.00  353802.6   113.2719   294682.7
18  520.8771  22.20086 6.00  353734.5   113.2798   294729.7
19  520.627   21.82721 6.00  353213.1   113.2859   294233.4
20  521.9471  21.31372 6.00  353371.    113.2795   294245.1
The sky and sky-subtracted source fluxes are plotted below:
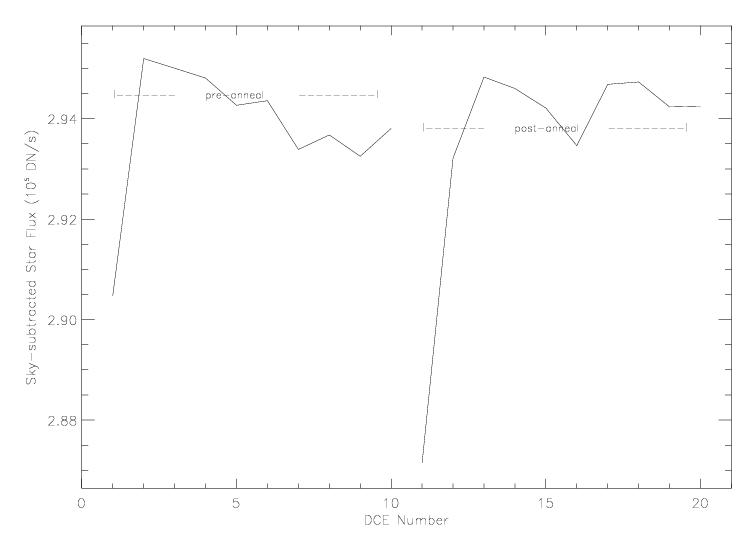
There are no obvious changes in the sky or source brightnesses following the thermal anneal. Any changes are smaller than the DCE to DCE variation.