Principal:
Deputy:
Analyst:
AORKEYS:
Last Updated:
We converted the diagnostic data from the thermal anneal into temperatures and generated temperature plots. These data are compared to the temperature curves from previous anneals. These data are presented in the metatask writeup mips-2050.
We compared the 24um SUR data taken before and after the thermal anneal to look for changes in array behavior. The items of interest were the noise levels on the detectors and the responsivity patterns.
A Vrst analysis was performed on the Vrst data, but unfortunately we discovered that the bias voltages were not set to 0V before the start of the exposure sequence. As a result, the bias voltages were being adjusted between -5 mV and 5 mV relative to their nominal values (30 mV at 160um, 40 mV at 70um) rather than between absolute biases of -5 mV and 5 mV. This invalidated the optimization.
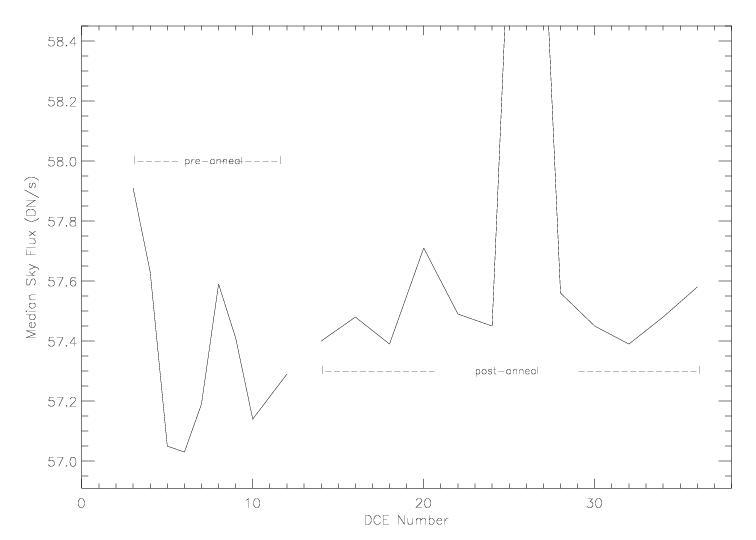
filename:  mips_IER_7407616_pht_A24_Pukn_pos-1_3s.red.fits
DCE Meansky   SkyDev    Medsky
 2    503.6     566.5     56.21
 3    507.3     571.4     57.91
 4    507.8     571.9     57.63
 5    508.2     571.4     57.05
 6    508.3     571.7     57.03
 7    508.7     572.2     57.19
 8    509.1     573.      57.59
 9    509.      572.9     57.41
10    509.      572.5     57.14
--- Thermal Anneal happened here ---
12    503.8     564.4     57.29
14    504.3     564.9     57.4
16    504.6     565.2     57.48
18    504.7     565.4     57.39
20    504.9     565.9     57.71
22    505.      565.9     57.49
24    504.9     565.7     57.45
26    505.7     568.8     60.13
28    505.2     566.      57.56
30    504.9     565.6     57.45
32    504.9     565.7     57.39
34    504.8     565.6     57.48
36    505.1      566.     57.58
The median sky fluxes are plotted below:
There are no obvious changes in the sky brightnesses following the thermal anneal. Any changes are smaller than the DCE to DCE variation.