Contact Stansberry - "; echo " there is a problem w/ your write-up.\n"; return ; } $row = mysql_fetch_array($result); $title = $row["title"]; $princ = $row["principal"]; $deputy= $row["deputy"]; $campn0 = $row["campn0"]; $aorkeys = $row["aorkeys"]; // get real name of principal, deputies $princ = ioc_get_person($princ); $princ = $princ[0]; $deps = explode(",",$deputy); foreach ($deps as $depty) { $depty = trim($depty); $depty = ioc_get_person($depty); $depty = $depty[0]; $depty = explode(",",$depty); $depty = $depty[0]; // last names only $deplist[] = $depty; } $deplist = implode(", ", $deplist); $caid = sprintf("%03d",$caid); $file = "mips-".$caid.$campn.".analysis.php"; // END PHP. ?> <? echo "MIPS-$caid, Campaign $campn IOC/SV Analysis"; ?>

Principal:
Deputy:
Analyst:
AORKEYS:
Last Updated:


Task Outcome Summary


Abstract

This task has four parts to it. First, a set of 10 3s SUR DCEs is collected with the same pointing that will be used later for the Vrst optimization. The goal is to get a before and after thermal anneal comparison of the responsivity of the 24um array. Second, diagnostic data is collected during 160um, 70um, and 24um thermal anneals. The third MIPS-992 activity is a Vrst optimization on the Ge arrays. The final activity in MIPS-992 is the state transitions Observe --> Ready --> Operate (i.e. MIPS off), and then Operate --> Boot --> Off. The successful completion of the transition was confirmed by the lack of any unexpected errors during the state transition. The thermal data from this task were nominal and are presented in the metatask mips-2050. The Vrst optimization data and 24um responsivity data are presented below.

Analysis

We converted the diagnostic data from the thermal anneal into temperatures and generated temperature plots. These data are compared to the temperature curves from previous anneals. These data are presented in the metatask writeup mips-2050.

We compared the 24um SUR data taken before and after the thermal anneal to look for changes in array behavior. The item of interest is the detector responsivity.

A Vrst analysis was performed on the Vrst data. In this test, the bias voltages for the 70um and 160um arrays are set to 0 mV, and then the Vrst voltages are adjusted between +5 mV and -5 mV relative to normal. A bright stim is turned on in manual mode during the test. The principle is that the array will produce a strong positive slope when positively biased and a strong negative slope when negatively biased, so the zero bias voltage point can be easily recognized. In practice, we calculate slope images and then look for this transition point.


Results

Temperature Plots from Anneal

The temperature behavior during the anneal was nominal. The temperature plots can be found in the writeup for MIPS-2050.

24 µm Responsivity

No star was present in the field during the running of MIPS-992. The sky brightnesses are presented below. I excluded all bias boost DCEs since they give false slope values. In lovely IRAF fashion, all of the mean and median numbers are integers, so the post-anneal stability is not as good as it appears here.
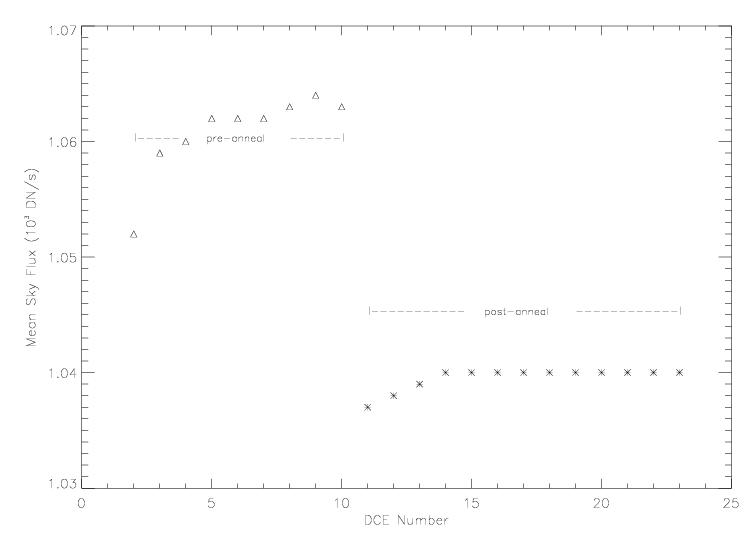
filename:  mips_IER_7529728_pht_A24_Pukn_pos-1_3s.red.fits
DCE  MeanSky  SkyDev    MedianSky
 2   1052.     107.4     1057.
 3   1059.      108.     1063.
 4   1060.     109.5     1065.
 5   1062.     110.2     1065.
 6   1062.     109.4     1066.
 7   1062.     107.4     1067.
 8   1063.     110.2     1065.
 9   1064.     115.1     1067.
10   1063.     109.2     1068.
--- Thermal Anneal happened here ---
12   1037.     71.73     1044.
14   1038.     71.58     1045.
16   1039.     72.21     1045.
18   1040.      72.5     1045.
20   1040.     73.55     1046.
22   1040.     73.75     1046.
24   1040.      72.9     1047.
26   1040.     72.12     1046.
28   1040.     74.03     1045.
30   1040.     72.88     1046.
32   1040.     72.23     1046.
34   1040.     73.13     1046.
36   1040.     72.81     1046.
The median sky fluxes are plotted below:

As mentioned in previous mips-992 writeups, the proper reference for the post-anneal data is the first data point from the pre-anneal data, which is the first DCE after a bias boost DCE. In this 24-hour long campaign, there seems to be a real change in Si detector response due to cosmic ray exposure. The change is from 1.04 to 1.052, or a 1.15% growth. This result will need to be verified in future campaigns.

The Vrst data are presented below. The filenames are MIPS.2/3.0007529728.00??.0001.01.mipl.fits.

File Bias 70_1  70_2  70_3  70_4  70_5  70_6  70_7  70_8 160_1 160_2 160_3 160_4
03   Nom  -10    10  -140  -160  -260  -210  -210  -240  -119  -157   -60   -19
04   +5  -330  -310  -360  -280  -350  -310  -360  -300  -460  -637  -323  -288
05   +4  -220  -280  -290  -290  -350  -300  -370  -300  -441  -495  -252  -154
06   +3  -140  -170  -190  -220  -320  -280  -290  -250  -313  -345  -173   -92
07   +2   -80   -40  -150  -180  -230  -250  -240  -220  -205  -226  -132   -52
08   +1   -30    20   -70  -130  -170  -180  -200  -180   -63  -135   -44   -13
09   Nom   40   120   -50  -100  -150  -150  -160  -140    39   -67     5    17
10   -1   110   180    30   -40  -100  -140  -100  -110   157    -6    56    51
11   -2   170   240   100     0   -30   -50   -60   -70   280    39   114    97
12   -3   220   270   160    60    30    10   -30   -40   431   124   192   150
13   -4   260   290   210   100    60    70    20   -20   596   199   270   217
14   -5   330   370   280   140   140   170    70    10   785   297   373   303
15   Nom -100  -120  -170  -260  -330  -280  -320  -260    55   -41    31    34

Vrst     +0.5  +1.25 -0.5  -2.0  -2.5  -3.0  -3.5  -4.5  +0.25 -1.0   0.0  +0.5
DAC Counts +2    +5    -2    -8   -10   -12   -14   -18    +1    -4     0    +2
DAC NOM   90E   8F7   910   8E7   916   90B   920   905   97D   91C   91C   913
New DAC   910   8FC   90E   8DF   90C   8FF   912   8F3   97E   918   91C   915


Conclusions

This campaign is about 24 hours long. The Si response seemed to grow by about 1.15% in this time. The Vcasn problem on side B of the 70um array has changed the optimum Vrst values on that side of the array by about 3 mV. The stability of the Vrst values on side A of the 70um array and on the 160um array looks to be very good. New Vrst values are being added to the mips-irs patch block based on the results of this Vrst optimization test. The thermal anneal behavior during this task appears to be nominal.

Output and Deliverable Products

None.

Actions Following Analysis

None.