Principal:
Deputy:
Analyst:
AORKEYS:
Last Updated:
We converted the diagnostic data from the thermal anneal into temperatures and generated temperature plots. These data are compared to the temperature curves from previous anneals. These data are presented in the metatask writeup mips-2050.
We compared the 24um SUR data taken before and after the thermal anneal to look for changes in array behavior. The item of interest is the detector responsivity.
A Vrst analysis was performed on the Vrst data. In this test, the bias voltages for the 70um and 160um arrays are set to 0 mV, and then the Vrst voltages are adjusted between +5 mV and -5 mV relative to normal. A bright stim is turned on in manual mode during the test. The principle is that the array will produce a strong positive slope when positively biased and a strong negative slope when negatively biased, so the zero bias voltage point can be easily recognized. In practice, we calculate slope images and then look for this transition point.
filenames:  MIPS.1.0007675648.0000.0000.01.tran_ext.fits
            MIPS.1.0007675648.0003.0000.01.tran_ext.fits
DCE  StarFlux SkyFlux    FrameMean     FrameMedian
 2  36141.    249.    249.3 +/- 78.88     247.
 3  36223.    251.    251.6 +/- 79.56     249.4
 4  36227.    252.    252.3 +/- 79.99     250.4
 5  36434.    251.    252.2 +/- 79.75     249.6
 6  36251.    252.    252.5 +/- 81.07     249.8
 7  36242.    252.    252.4 +/- 79.2      250.1
 8  36255.    252.    252.6 +/- 79.92     250.5
 9  36294.    253.    252.5 +/- 79.7      249.7
10  36419.    252.    252.5 +/- 80.38     249.9
--- Thermal Anneal happened here ---
 2  33571.    242.    243.2 +/- 59.31     242.2
 4  33650.    243.    243.7 +/- 59.71     243.3
 6  33758.    243.    244.1 +/- 63.6      243.
 8  33693.    243.    244.3 +/- 60.65     243.5
10  33760.    243.    244.3 +/- 60.03     243.
12  34072.    242.    244.3 +/- 59.79     243.1
14  33792.    243.    244.4 +/- 59.71     242.8
16  33810.    243.    244.5 +/- 59.7      243
18  33825.    243.    244.5 +/- 59.67     244.1
20  33795.    243.    244.7 +/- 59.67     243.
22  34036.    243.    244.7 +/- 59.88     244.
24  33769.    243.    244.8 +/- 59.52     243.7
26  33752.    243.    245.1 +/- 60.36     243.9
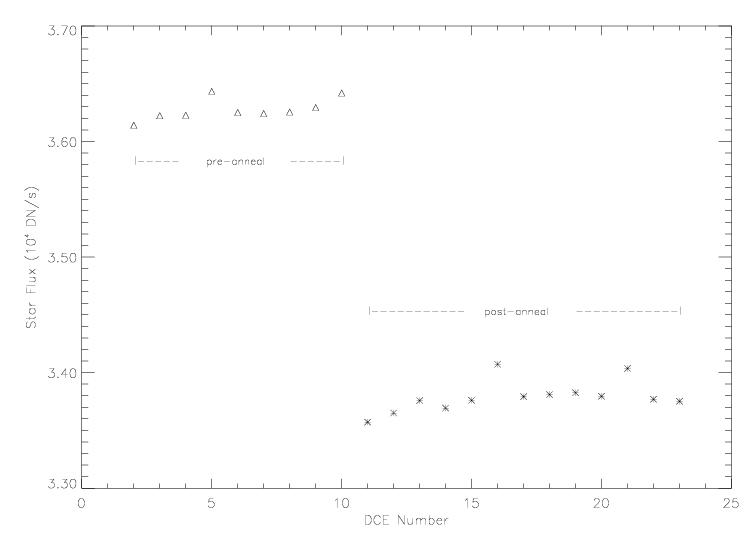
The median star and sky fluxes are plotted below:
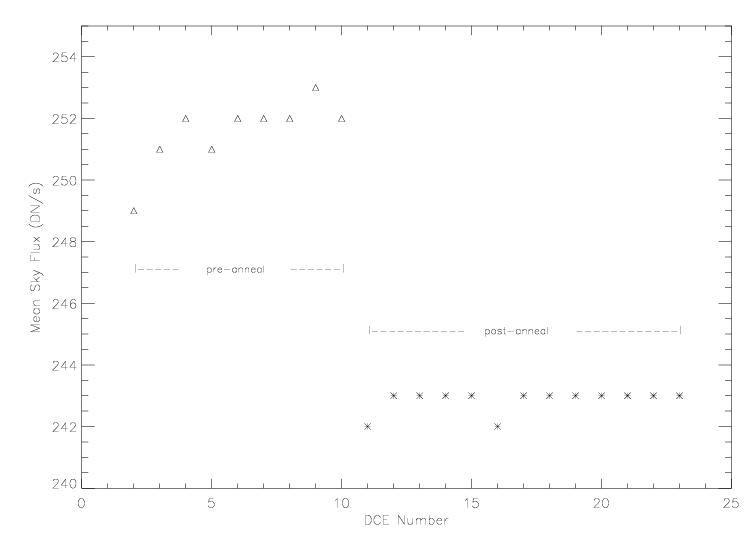
As mentioned in previous mips-992 writeups, the proper reference for the post-anneal data is the first data point from the pre-anneal data, which is the first DCE after a bias boost DCE. In this 18-hour long campaign, there seems to be a real change in Si detector response due to cosmic ray exposure. The growth in star flux is 7%, while the growth in sky levels is about 2.5%.
The Vrst data are presented below. The filenames are MIPS.2/3.0007675648.00??.0001.01.mipl.fits. I ignored the last 72 frames in the 70um Vrst slope calculations. The 160um stim is brighter now than it used to be so I had to ignore 76 frames.
File Bias 70_1  70_2  70_3  70_4  70_5  70_6  70_7  70_8 160_1 160_2 160_3 160_4
03   Nom   60   220   -90   -40  -190  -190  -240  -200   176  -338     8    36
04   +5  -380  -380  -340  -300  -270  -220  -290  -230  -923 -1327  -545  -345
05   +4  -310  -330  -320  -260  -310  -250  -320  -270  -801 -1054  -432  -228
06   +3  -210  -210  -280  -200  -320  -240  -340  -280  -449  -722  -287  -130
07   +2  -100   -90  -190  -180  -280  -210  -300  -260  -143  -450  -133   -53
08   +1     0    60  -120  -100  -250  -220  -260  -250   147  -238   -11    17
09   Nom  100   210   -30  -100  -220  -160  -200  -220   443   -77   112    91
10   -1   200   310    60   -10  -160  -110  -200  -170   733    76   241   179
11   -2   290   370   160    30   -90   -30  -180  -100  1033   243   439   289
12   -3   380   440   250   110    60    30  -110   -90  1405   428   598   428
13   -4   470   480   340   140   140   130    20   -30  1827   629   757   610
14   -5   560   500   430   210   310   310   190    50  2330   852   958   764
15   Nom -160  -150  -220  -210  -270  -220  -270  -250   245   -79    93    98

Vrst     +1.0  +1.5  -0.25 -1.5  -2.5  -2.5  -4.0  -4.25 +1.5  -0.5  +1.0  +1.25
DAC Counts +4    +6    -1    -6   -10   -10   -16   -17    +6    -2     4    +5
DAC NOM   90E   8F7   910   8E7   916   90B   920   905   97D   91C   91C   913
New DAC   912   8FD   90F   8E1   90C   901   910   8F4   983   91A   920   918