Principal:
Deputy:
Analyst:
AORKEYS:
Last Updated:
We converted the diagnostic data from the thermal anneal into temperatures and generated temperature plots. These data are compared to the temperature curves from previous anneals. These data are presented in the metatask writeup mips-2050.
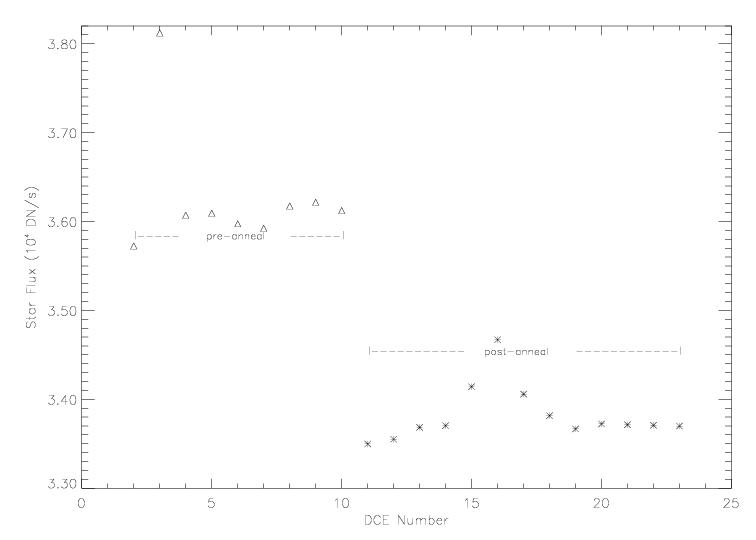
We compared the 24um SUR data taken before and after the thermal anneal to look for changes in array behavior. The item of interest is the detector responsivity.
A Vrst analysis was performed on the Vrst data. In this test, the bias voltages for the 70um and 160um arrays are set to 0 mV, and then the Vrst voltages are adjusted between +5 mV and -5 mV relative to normal. A bright stim is turned on in manual mode during the test. The principle is that the array will produce a strong positive slope when positively biased and a strong negative slope when negatively biased, so the zero bias voltage point can be easily recognized. In practice, we calculate slope images and then look for this transition point.
filenames:  mips_IER_7739136_gen_0_A24_Pukn_3s.fits
            mips_IER_7739136_gen_(3-15)_A24_Pukn_3s.fits
DCE  StarFlux SkyFlux    FrameMean     FrameMedian
 2    35725.    250.   250.2 +/- 89.97     246.7
 3    38122.    251.   252.3 +/- 82.29     249.3
 4    36071.    252.   253.4 +/- 82.32     250.8
 5    36093.    252.   254.3 +/- 91.09     250.4
 6    35974.    254.   254.  +/- 84.33     251.
 7    35923.    254.   254.4 +/-  84.1     251.7
 8    36175.    253.   254.4 +/- 84.45     251.5
 9    36217.    253.   253.6 +/- 79.42     251.
10    36123.    254.   254.1 +/- 80.37     251.4
--- Thermal Anneal happened here ---
 2    33497.    243.   245.  +/- 60.72     243.9
 4    33550.    244.   245.4 +/- 60.56     243.9
 6    33684.    244.   246.1 +/- 62.29     244.7
 8    33702.    244.   246.1 +/- 61.76     244.
10    34141.    245.   246.4 +/- 62.27     244.8
12    34669.    244.   246.4 +/- 62.48     244.4
14    34057.    244.   246.1 +/- 60.44     245.1
16    33815.    244.   246.6 +/- 61.23     245.
18    33666.    245.   246.6 +/- 61.62     245.3
20    33722.    245.   246.8 +/- 61.88     245.2
22    33713.    245.   246.8 +/- 62.4      245.3
24    33708.    244.   246.4 +/- 70.44     244.9
26    33698.    245.   247.4 +/- 63.38     245.4
The median star and sky fluxes are plotted below:
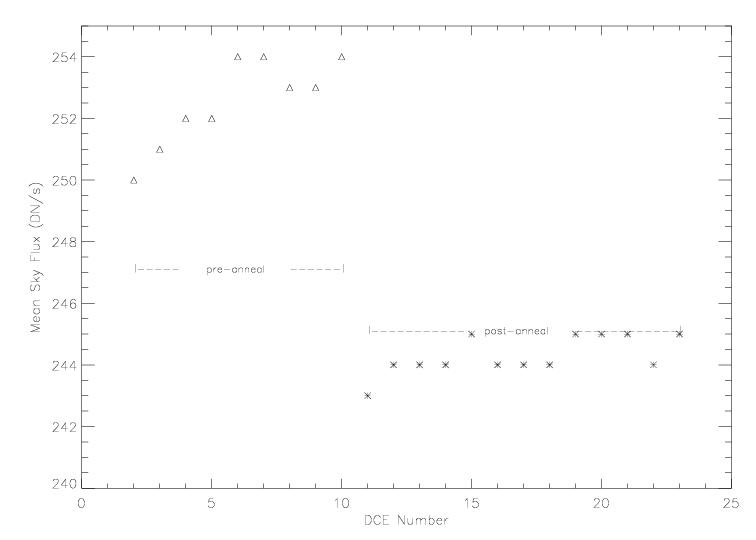
As mentioned in previous mips-992 writeups, the proper reference for the post-anneal data is the first data point from the pre-anneal data, which is the first DCE after a bias boost DCE. In this 23-hour long campaign, there seems to be a real change in Si detector response due to cosmic ray exposure. The growth in star flux is 6%, while the growth in sky levels is about 2.25%. No flatfielding was performed, so the sky flux change is the more realistic number.
The Vrst data are presented below. The filenames are MIPS.2/3.0007675648.00??.0001.01.mipl.fits. I ignored the last 72 frames in the 70um Vrst slope calculations. The 160um stim is brighter now than it used to be so I had to ignore 76 frames.
File Bias 70_1  70_2  70_3  70_4  70_5  70_6  70_7  70_8 160_1 160_2 160_3 160_4
03   Nom -260  -260  -300  -240  -300  -180  -240  -200    26   -51     2    12
04   +5  -350  -320  -340  -280  -330  -230  -320  -210  -321  -360  -201  -131
05   +4  -280  -250  -310  -280  -320  -270  -350  -320  -209  -281  -170   -88
06   +3  -220  -190  -270  -250  -240  -230  -260  -180  -129  -179   -81   -67
07   +2  -170  -150  -190  -220  -210  -200  -190  -180   -48  -130   -46   -20
08   +1   -80   -60  -140  -190  -140  -150  -170  -150    25   -60     2    14
09   Nom  -50    20  -100  -100  -140  -110  -140  -120    83   -22    33    31:10   -1    30   120   -30   -60   -70    20   -90  -110   155    15   135    65
11   -2    90   180    50   -10   -40   -30   -40   -50   248    52   117:  101
12   -3   140   210    80    40    30    40     0   -40   376   104   178   143
13   -4   220   290   160    30   140   100    30   -10   478   149   234:  206
14   -5   250   300   240    80   180   160    70    20   576:  234   333   248:15   Nom -150  -110  -210  -230  -270  -210  -260  -200    82   -16    43    35:

Vrst     -0.5  +0.25 -1.5  -2.25 -2.5  -2.5  -3.0  -4.5  +1.5  -0.5  +1.0  +1.5 DAC Counts -2    +1    -6    -9   -10   -10   -12   -18    +6    -2     4    +6
DAC NOM   90E   8F7   910   8E7   916   90B   920   905   97D   91C   91C   913
New DAC   90C   8F8   90A   8DE   90C   901   914   8F3   983   91A   920   919