Principal:
Deputy:
Analyst:
AORKEYS:
Last Updated:
We converted the diagnostic data from the thermal anneal into temperatures and generated temperature plots. These data are compared to the temperature curves from previous anneals. These data are presented in the metatask writeup mips-2050.
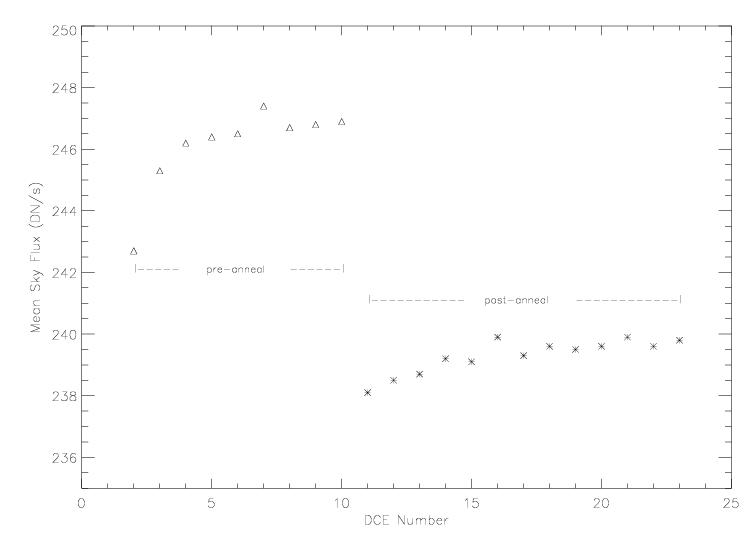
We compared the 24um SUR data taken before and after the thermal anneal to look for changes in array behavior. The item of interest is the detector responsivity.
A Vrst analysis was performed on the Vrst data. In this test, the bias voltages for the 70um and 160um arrays are set to 0 mV, and then the Vrst voltages are adjusted between +5 mV and -5 mV relative to normal. A bright stim is turned on in manual mode during the test. The principle is that the array will produce a strong positive slope when positively biased and a strong negative slope when negatively biased, so the zero bias voltage point can be easily recognized. In practice, we calculate slope images and then look for this transition point.
filenames:  mips_IER_7781376_gen_0_A24_Pukn_3s.fits
            mips_IER_7781376_gen_(3-15)_A24_Pukn_3s.fits
DCE    FrameMean     FrameMedian
 2    242.7 +/- 46.34     242.4
 3    245.3 +/- 47.11     244.6
 4    246.2 +/- 49.15     246.3
 5    246.4 +/- 46.89     246.5
 6    246.5 +/- 46.96     246.5
 7    247.4 +/-  54.9     246.4
 8    246.7 +/- 46.77     246.9
 9    246.8 +/- 46.95     246.9
10    246.9 +/- 46.88     246.5
--- Thermal Anneal happened here ---
 2    238.1 +/- 24.49     238.7
 4    238.5 +/- 24.91     239.1
 6    238.7 +/- 25.12     239.5
 8    239.2 +/- 27.58     239.5
10    239.1 +/- 24.44     240.
12    239.9 +/- 34.22     240.2
14    239.3 +/- 24.74     239.8
16    239.6 +/- 25.34     239.9
18    239.5 +/- 25.34     240.7
20    239.6 +/- 25.03     240.3
22    239.9 +/- 26.16     240.8
24    239.6 +/- 24.81     240.8
26    239.8 +/- 25.07     240.9
The median sky flux is plotted below:
As mentioned in previous mips-992 writeups, the proper reference for the post-anneal data is the first data point from the pre-anneal data, which is the first DCE after a bias boost DCE. In this 16-hour long campaign, the change in Si detector response is about 1.3%.
The Vrst data are presented below. The filenames are MIPS.2/3.0007781376.00??.0001.01.mipl.fits. I ignored the last 72 frames in the 70um Vrst slope calculations. The 160um stim is brighter now than it used to be so I had to ignore 76 frames.
File Bias 70_1  70_2  70_3  70_4  70_5  70_6  70_7  70_8 160_1 160_2 160_3 160_4
03   Nom  -30   -80  -120  -170  -180  -140  -110  -160   186  -196    22    43
04   +5  -220  -210  -290  -260  -330  -230  -300  -200  -913 -1356  -549  -405
05   +4  -140  -120  -190  -230  -240  -210  -220  -190  -890 -1120  -432  -258
06   +3   -90   -70  -130  -170  -180  -160  -170  -150  -485  -748  -278  -143
07   +2   -40   -20   -90  -120  -130  -160  -140  -130  -157  -475  -130   -58
08   +1     0    30   -50   -80   -90  -110  -100  -110   166  -255     5    30
09   Nom   30    70   -20   -40   -60   -90   -70   -80   482   -83   145   106
10   -1    80   120    20   -30   -40   -60   -50   -50   799    86   289   204
11   -2   120   170    60    10   -20   -20   -20   -40  1131   269   470   330
12   -3   150   190   100    40    20    20    20   -30  1534   471   627   478
13   -4   180   200   130    60    50    60    30   -10  1990   671   824   652
14   -5   210   220   190    80   130    90    60    10  2597   962  1057   891
15   Nom  -70   -70   -90  -180  -230  -180  -200  -170   270   -82   113   115

Vrst     +1.0  +1.5  -0.5  -1.5  -2.5  -2.5  -2.5  -4.5  +1.5  -0.5  +1.0  +1.25
DAC Counts +4    +6    -2    -6   -10   -10   -10   -18    +6    -2     4    +5
DAC NOM   90E   8F7   910   8E7   916   90B   920   905   97D   91C   91C   913
New DAC   912   8FD   90E   8E1   90C   901   916   8F3   983   91A   920   918