Principal:
Deputy:
Analyst:
AORKEYS:
Last Updated:
We converted the diagnostic data from the thermal anneal into temperatures and generated temperature plots. These data are compared to the temperature curves from previous anneals. These data are presented in the metatask writeup mips-2050.
We compared the 24um SUR data taken before and after the thermal anneal to look for changes in array behavior. The item of interest is the detector responsivity.
A Vrst analysis was performed on the Vrst data. In this test, the bias voltages for the 70um and 160um arrays are set to 0 mV, and then the Vrst voltages are adjusted between +5 mV and -5 mV relative to normal. A bright stim is turned on in manual mode during the test. The principle is that the array will produce a strong positive slope when positively biased and a strong negative slope when negatively biased, so the zero bias voltage point can be easily recognized. In practice, we calculate slope images and then look for this transition point.
filenames:  mips_IER_7784704_gen_0_A24_Pukn_3s.fits
            mips_IER_7784704_gen_(3-15)_A24_Pukn_10s.fits
DCE     FrameMean     FrameMedian
 2    242.1 +/- 49.58     241.2
 3    244.7 +/- 51.01     243.8
 4    246.1 +/- 50.99     245.7
 5    245.7 +/- 48.98     245.
 6    246.  +/- 49.7      245.6
 7    246.4 +/- 49.43     245.6
 8    246.7 +/- 51.5      245.7
 9    246.3 +/- 49.05     245.6
10    246.4 +/- 49.15     246.3
--- Thermal Anneal happened here ---
 2    238.1 +/- 24.98     239.3
 4    238.2 +/- 24.81     239.1
 6    238.6 +/- 25.44     239.3
 8    239.  +/- 25.72     239.6
10    239.  +/- 25.58     239.9
12    239.1 +/- 25.56     239.9
14    239.4 +/- 26.25     239.7
16    239.5 +/- 26.81     240.2
18    239.4 +/- 25.45     240.3
20    239.4 +/- 25.73     240.4
22    239.5 +/- 25.79     239.8
24    239.5 +/- 25.23     240.5
26    239.6 +/- 25.55     240.2
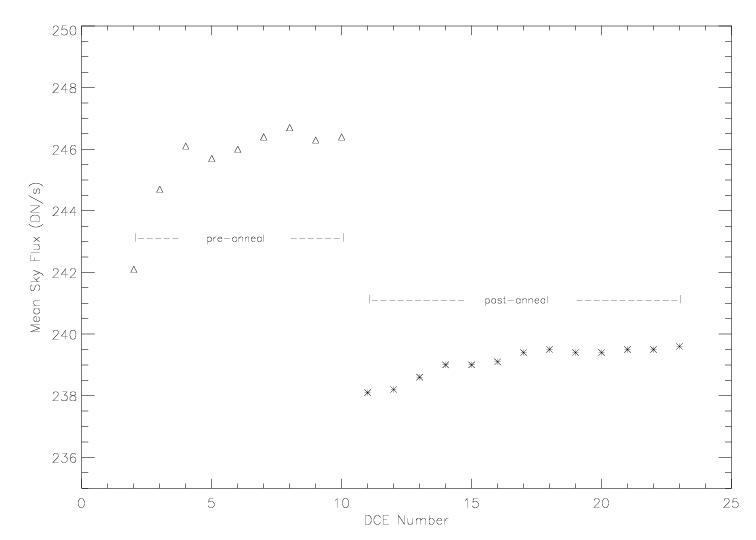
The median sky fluxes are plotted below:
As mentioned in previous mips-992 writeups, the proper reference for the post-anneal data is the first data point from the pre-anneal data, which is the first DCE after a bias boost DCE. In this 49-hour long campaign, the growth in Si detector response due to cosmic ray exposure is 1.0%.
The Vrst data are presented below. The filenames are MIPS_IER_7784704_gen_*_A70/A160_Pukn_10s.fits. I analyzed the data using SIRTFSEE, so I used the first DCE in each pair of observations for this analysis, whereas I used the 2nd DCE in all previous analyses. I ignored the first frame and the last 72 frames in the 70um Vrst slope calculations. I ignored the last 76 frames in the 160 Vrst slope calculations. This campaign is the first one in which we had real Ge anneals, which is another difference that might be partially responsible for the noticeably different Vrst values that were determined below.
File Bias 70_1  70_2  70_3  70_4  70_5  70_6  70_7  70_8 160_1 160_2 160_3 160_4
03   Nom   80  -110    10   -60   -60   -40    40  -150    92   -80    17    28
04   +5   -85  -135  -115  -180  -150  -160   -85  -165  -897  -689  -372  -232
05   +4   -50   -65   -80  -135  -120  -130   -65  -130  -697  -479  -244  -125
06   +3   -35   -20   -55   -90   -90  -110   -65  -110  -389  -332  -141   -74
07   +2   -20    10   -40   -70   -90  -105   -70  -100  -130  -202   -60   -13
08   +1     0    35   -30   -50   -70   -80   -60   -80    84  -107     8    20
09   Nom   20    60   -10   -40   -60   -70   -50   -70   319   -22    82    62
10   -1    30    85    10   -20   -65   -60   -55   -75   568    67   160   122
11   -2    50   110    25    10   -50   -50   -40   -60   820   154   249   179
12   -3    85   150    40     0   -40   -40   -40   -40  1099   256   354   264
13   -4   100   170   100    30   -20   -25   -30   -50  1425   372   482   355
14   -5   100   170    80    50   -15   -10   -20   -40  1820   490   602   460
15   Nom  -30   -50   -45   -95   -90  -120   -90  -120   167   -22    79    78

Vrst     +1.0  +2.5  -0.5  -2.0  -6.0  -5.75 -7.0  -7.0  +0.75 -0.25 +1.0  +1.5
DAC Counts +4   +10    -2    -8   -24   -23   -28   -28    +3    -1     4    +6
DAC NOM   90E   8F7   910   8E7   916   90B   920   905   97D   91C   91C   913
New DAC   912   901   90E   8DF   8FE   8F4   904   8E9   980   91B   920   919