Contact Stansberry - "; echo " there is a problem w/ your write-up.\n"; return ; } $row = mysql_fetch_array($result); $title = $row["title"]; $princ = $row["principal"]; $deputy= $row["deputy"]; $campn0 = $row["campn0"]; $aorkeys = $row["aorkeys"]; // get real name of principal, deputies $princ = ioc_get_person($princ); $princ = $princ[0]; $deps = explode(",",$deputy); foreach ($deps as $depty) { $depty = trim($depty); $depty = ioc_get_person($depty); $depty = $depty[0]; $depty = explode(",",$depty); $depty = $depty[0]; // last names only $deplist[] = $depty; } $deplist = implode(", ", $deplist); $caid = sprintf("%03d",$caid); $file = "mips-".$caid.$campn.".analysis.php"; // END PHP. ?> <? echo "MIPS-$caid, Campaign $campn IOC/SV Analysis"; ?>

Principal:
Deputy:
Analyst:
AORKEYS:
Last Updated:


Task Outcome Summary


Abstract

This task has four parts to it. First, a set of 10 3s SUR DCEs is collected with the same pointing that will be used later for the Vrst optimization. The goal is to get a before and after thermal anneal comparison of the responsivity of the 24um array. Second, diagnostic data is collected during 160um, 70um, and 24um thermal anneals. The third MIPS-992 activity is a Vrst optimization on the Ge arrays. The final activity in MIPS-992 is the state transitions Observe --> Ready --> Operate (i.e. MIPS off), and then Operate --> Boot --> Off. The successful completion of the transition was confirmed by the lack of any unexpected errors during the state transition. The thermal data from this task were nominal and are presented in the metatask mips-2050. The Vrst optimization data and 24um responsivity data are presented below.

Analysis

We converted the diagnostic data from the thermal anneal into temperatures and generated temperature plots. These data are compared to the temperature curves from previous anneals. These data are presented in the metatask writeup mips-2050.

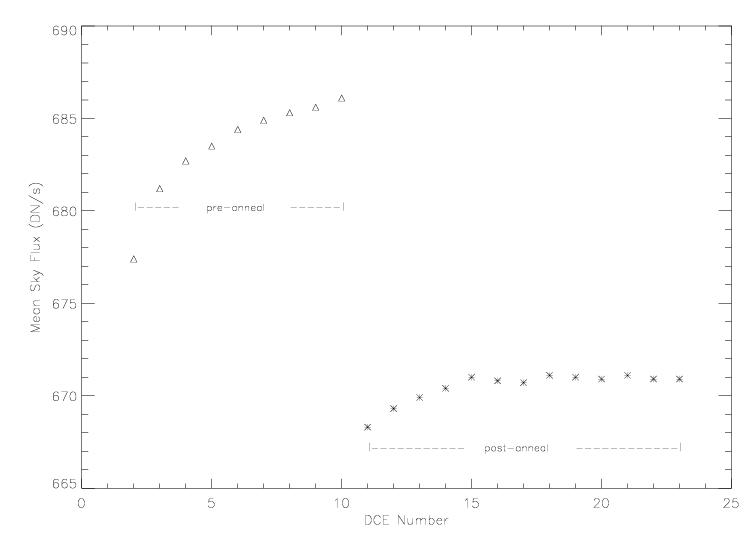
We compared the 24um SUR data taken before and after the thermal anneal to look for changes in array behavior. The item of interest is the detector responsivity.

A Vrst analysis was performed on the Vrst data. In this test, the bias voltages for the 70um and 160um arrays are set to 0 mV, and then the Vrst voltages are adjusted between +5 mV and -5 mV relative to normal. A bright stim is turned on in manual mode during the test. The principle is that the array will produce a strong positive slope when positively biased and a strong negative slope when negatively biased, so the zero bias voltage point can be easily recognized. In practice, we calculate slope images and then look for this transition point.


Results

Temperature Plots from Anneal

The temperature behavior during the anneals was as expected. The temperature plots can be found in the writeup for MIPS-2050.

Vrst Optimization

All Vrst data were analyzed using mips_sloper and IDL routines. The results are presented in the writeup for metatask MIPS-2075.

24 µm Responsivity

Sky brightnesses were measured using the IRAF task imstat and are presented below. I excluded all bias boost DCEs since they give false slope values.
 
filenames:  MIPS.1.0007849216.0000.000(1-9).tran.fits
            MIPS.1.0007849216.00(03-15).0001.tran.fits
DCE     FrameMean     FrameMedian
 2  677.4 +/- 114.4     676.3
 3  681.2 +/- 115.5     680.3
 4  682.7 +/- 115.3     681.2
 5  683.5 +/- 114.9     682.3
 6  684.4 +/- 115.1     683.
 7  684.9 +/- 114.5     683.1
 8  685.3 +/- 114.9     684.5
 9  685.6 +/- 114.5     685.3
10  686.1 +/- 114.6     685.7
--- Thermal Anneal happened here ---
 2  668.3 +/- 68.94     668.1
 4  669.3 +/- 69.26     670.
 6  669.9 +/- 69.23     669.6
 8  670.4 +/- 69.08     670.7
10  671.  +/- 69.56     670.8
12  670.8 +/- 68.25     671.
14  670.7 +/- 67.03     671.1
16  671.1 +/- 66.59     670.6
18  671.  +/- 66.14     670.3
20  670.9 +/- 67.02     670.3
22  671.1 +/- 68.3      670.6
24  670.9 +/- 69.16     672.
26  670.9 +/- 69.71     671.3
The median sky fluxes are plotted below:

As mentioned in previous mips-992 writeups, the proper reference for the post-anneal data is the first data point from the pre-anneal data, which is the first DCE after a bias boost DCE. In this 50-hour long campaign, the reduction in Si detector response following the thermal anneal was about 1.0%.


Conclusions

This campaign is about 50 hours long. The Si response following the end thermal anneal was about 1.0% lower than the pre-anneal response, which is the level expected for a post-anneal transient. There is no evidence that cosmic rays have enhanced the detector response, even after 50 hours of exposure. The thermal anneal behavior during this task was as expected. The Vrst voltages were consistent with previous measurements.

Output and Deliverable Products

None.

Actions Following Analysis

None.