24micron PHOTOMETRY Flats as a Function of Scan
Mirror Position
Almudena Alonso-Herrero, Steward Observatory
Last revision: Oct 2, 2003
ABSTRACT
Observations obtained in 24micron PHOTOMETRY mode reveal the presence
of the so-called "Dark Spots" which are regions of a few pixels approximately
20% dimmer than the surrounding pixels. These "Dark Spots" move with sources
for scan mirror positions, and thus to remove them from 24micron observations
we need to construct 24micron Flatfields for each of the scan mirror positions
used during the observation. We use the 24micron flatfields observed in Campaigns
D2 and E to construct flatfields at the 7 scan mirror positions used by
SMALL FIELD PHOTOMETRY, that is, CSM_PRED=1864.5, 1886., 1907.5, 1929.,
2106.5, 2128., and 2149.5. Ratios of flatfields constructed with flats with
increasing (or decreasing) scan mirror angle show how these "Dark Spots"
move in terms of the scan mirror position. Apart from the already detected
three bright "Dark Spots" in the upper left corner, we can see that there
is a number of more diffuse and fainter ones at other positions across the
24micron array. Clearly, it is essential that at 24micron we flatfield each
observed DCE with a 24micron flatfield with matching scan mirror position.
AOR keys: 6764032, 6764288, 6770176, 6770432
DESCRIPTION
Observations obtained in 24micron PHOTOMETRY mode reveal the presence
of the so-called "Dark Spots" approximately 20% dimmer than the surrounding
pixels (see MIPS Campaign D2 Anomaly Report). Since they move analogously
to sources for scan mirror moves, but do not move when the telescope nods,
to remove them from observations we will need to construct 24micron Flatfields
for those scan mirror positions. These "Dark Spots" are attributed to debris
on the pick-off mirror.
We use the 24micron PHOTOMETRY flatfields observed in campaigns D2 and
E to construct 24micron flatfields as a function of the Scan Mirror Position,
that is, we use all the observations available of MIPS-917. The MIPS-917
flatfields are observed in PHOTOMETRY SMALL FIELD. Each MIPS-917 observation
consists of a 4 point dither map (1 cycle, using the cluster mode) with 3
second DCEs, providing a total of 64DCEs. The predicted scan mirror positions
(keyword: CSM_PRED) as a function of the DCE number are:
DCE CSM_PRED
[1] 1929. - BIAS BOOST FRAME
(not used)
[2] 2149.5
[3] 1907.5
[4] 2128.
[5] 1886.
[6] 2106.5
[7] 1864.5
[8] 1929.
[9] 1929. - BIAS BOOST FRAME
(not used)
[10] 2149.5
[11] 1907.5
[12] 2128.
[13] 1886.
[14] 2106.5
[15] 1864.5
[16] 1929.
For each of the 7 scan mirror positions used in the 24micron SMALL FIELD
PHOTOMETRY MODE we construct a flatfield using the imcombine and bscale
tasks in IRAF, so each flatfield is the result of median combining 32DCEs.
Statistics on the normalized flatfields provides the following:
IMAGE
NPIX MEAN STDDEV
MIN MAX
flat_CSMeq1865_norm.fits 16362
1.006 0.05381 0.8285
1.238
flat_CSMeq1886_norm.fits 16362
1.007 0.05375 0.8282
1.234
flat_CSMeq1908_norm.fits 16362
1.005 0.0534
0.8273 1.23
flat_CSMeq1929_norm.fits 16362
1.005 0.05354 0.8277
1.238
flat_CSMeq2107_norm.fits 16362
1.005 0.05343 0.7972
1.231
flat_CSMeq2128_norm.fits 16362
1.003 0.05337 0.7677
1.229
flat_CSMeq2149_norm.fits 16362
1.007 0.05338 0.7986
1.233
The standard deviation of the flatfiels constructed for different scan
mirror positions is similar to that of the flatfields constructed combining
64 or 128DCEs (i.e., see Analysis report of MIPS-917 in D2 and E).
To assess the qualitative differences of 24micron flatfields observed
at different scan mirror positions we do ratios flatfields with CSM_PRED
values in a sequential way, that is,
ratio1=flat_CSMeq1865_norm.fits / flat_CSMeq1886_norm.fits
ratio2=flat_CSMeq1886_norm.fits / flat_CSMeq1908_norm.fits
ratio3=flat_CSMeq1908_norm.fits / flat_CSMeq1929_norm.fits
ratio4=flat_CSMeq1929_norm.fits / flat_CSMeq2107_norm.fits
ratio5=flat_CSMeq2107_norm.fits / flat_CSMeq2128_norm.fits
ratio6=flat_CSMeq2128_norm.fits / flat_CSMeq2149_norm.fits
ratio7=flat_CSMeq2149_norm.fits / flat_CSMeq1865_norm.fits
The ratios of 24micron flatfields with different scan mirror positions
are shown in Figures 1 and 2. The ratios of flatfields observed with increasing
scan mirror position clearly show how the 24micron 'Dark Spots' move with
changing mirror position. Apart from the bright three "Dark Spots" in the
upper left corner already detected, we can see that there is a number of
more diffuse and fainter ones at other positions across the 24micron array.
Clearly, it is essential that at 24micron we flatfield each observed DCE
with a 24micron flatfield matching the observed scan mirror position.
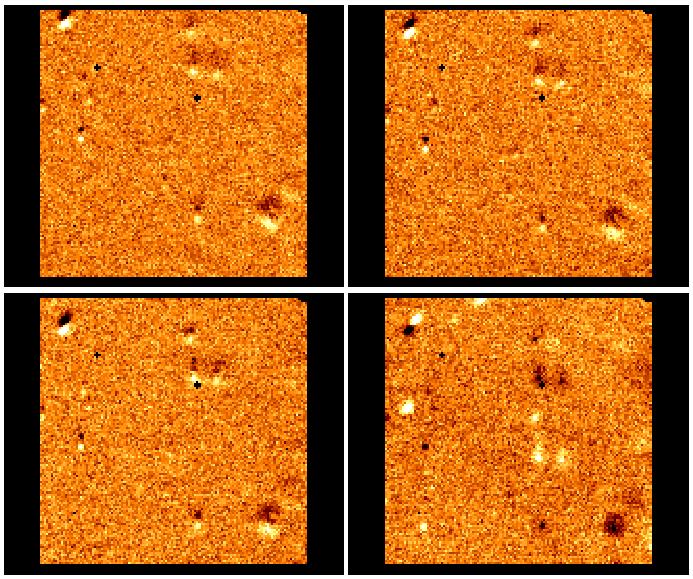
Figure1. We show from ratios of flatfields constructed for different
scan mirror positions (those used in SMALL FIELD PHOTOMETRY). From the upper
left corner and clockwise we show ratio1, ratio2, ratio4 and ratio3 with
display levels z1=0.97 and z2=1.01.
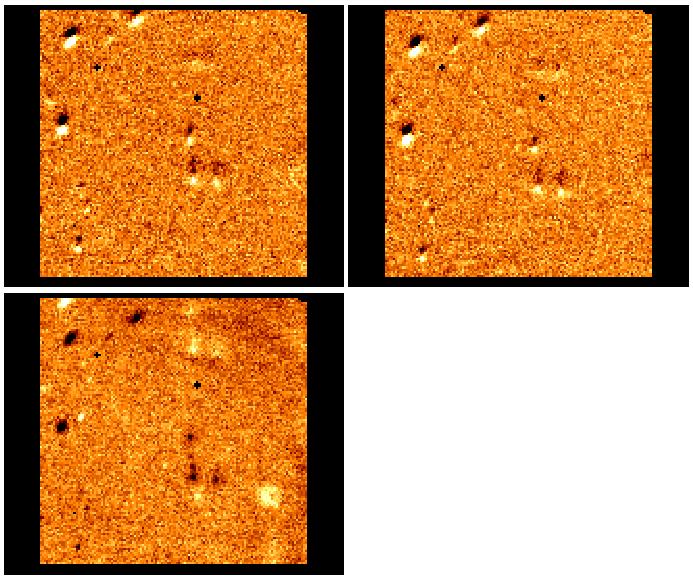
Figure2. As Figure1 but for ratio5 (upper left), ratio6 (upper
right) and ratio7 (lower left).
For LARGE FIELD PHOTOMETRY MODE the CSM_PRED values are:
2007.12, 2021.5, 1999.875, 2014.25, 1992.625
Flatfields for these values of CSM_PRED could be interpolated from the
24micron flatfields observed in SMALL FIELD PHOTOMETRY MODE.
In Figure3 we show the results of flatfielding data with one single flatfield
(upper panel) and using different flatfields constructed as a function
of different scan mirror positions (lower panel).
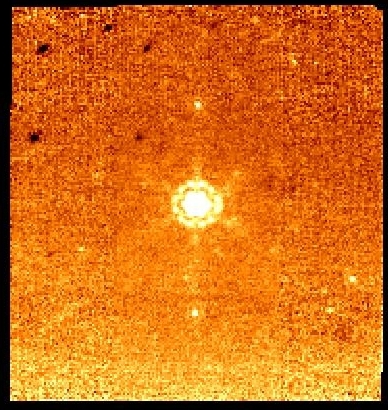
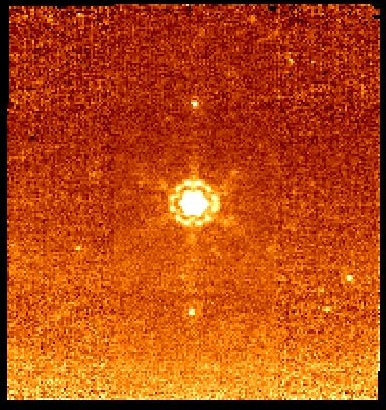
Figure3. The upper panel is a star observation flatfielded using one
single flatfield. The lower panel shows the same observation where each DCE
was flatfield with a matching CSM_PRED flatfield. The two images are shown
with the same display values. The mosaics were produced with the IRAF task
imcombine!