Figure 1. DN image for the reset-read frame of the 1st DCE in the 24 µm RAW exposure.
Principal:
Deputy:
Analyst:
AORKEYS:
Last Updated:
Considerable analysis of telemetry from Campaign A1 was performed to compare with ground-test data, and to verify correct instrument operation. The report summarizing the telemetry analysis is available here.
Telemetry was also analyzed to verify correct operation during the Photometry AOR run as a part of this task (see below). In particular, telemetry pertaining to S/C pointing and array FOV pointing (including CSMM deflections) was examined.
All 3 arrays were subjected to thermal anneals at the beginning of the campaign. The analysis of various instrument temperatures during those anneals is available here.
For the 24 µm data the DN image from the reset-read frame of the RAW data exposure was examined. In the first DCE the reset-read frame is the 3rd one (it follows the boost frame and reset frame that follows it - these occur in the first DCE of any 24um data exposure). In subsequent DCEs the reset-read frame is the 1st read in the DCE. The DN for the reset-read frame were also plotted for all pixels to verify that the data ramps start above the bottom rail of the ADC (a prerequisite for SUR mode data to be valid).
For the Ge data the DN image from the first read in the positive-saturated DCEs was examined to look for any un-saturated pixels. The DN for all reads was plotted for the two readouts with shorts (the old one, readout 4,7, and the new one, readout 4,4). Both types of analysis were also carried out on the scattered backgound monitor data (mips-950), which were also effectively saturated at the positive rail.
The array data were collected in 3 separate exposures in the rail-to-rail IER:
The raw data for the positive-saturated rail portion of the test are the most interesting, revealing that the 3 shorts detected prior to launch on various Ge array readouts were present, and behaving much as seen earlier. The data from this exposure also revealed a new short on a readout of the 70um array. Because this was a raw exposure, the 24 µm data were also interesting because they showed that array to be alive, essentially unchanged from pre-flight, and with all data ramps starting on-scale for the readout ADC, a requirement for the on-board SUR processing algorithm to work.
Figure 1 shows the reset-read frame of the first DCE in the RAW
exposure. The pixel-to-pixel variations, with higher ramp starting points
towards the bottom of the array, are nearly identical to what was seen
on the ground, except that the jailbar pattern is not as evident here.
Figure 1. DN image for the reset-read frame of the 1st DCE in the 24 µm RAW exposure.
Figure 2 shows a plot of the DN from the RAW exposure reset-read frame. The ramps
must begin on-scale for the ADC in order for the slopes computed by the on-board
SUR algorithm to be valid. This figure demonstrates that this condition is met.
Figure 2. DN at the beginning of the RAW ramp for all pixels on the 24 µm array.
Figure 3 shows the DN image at the first read in the data ramp for the second DCE collected in the rail-to-rail test while the output was being driven to the positive rail of the ADC. All positive-rail DCEs looked this way. The entire array was saturated by the second read (not shown). The image was taken with the CSMM in the 24um dark position, which places the 70 µm array in Narrow Field Imaging mode. The image shows 3 effects:
Figure 3. 70 µm array image showing DN at the first read in the data ramp. Scaling is from 20k - 60k DN. Two 4x8 pixel blocks associated with individual readouts are clearly visible in the lower portion of the figure.
In the negative rail data for the 70 µm array all pixels read 0 DN for all reads in all DCEs, demonstrating the functionality of the entire array except for the dead readout noted above.
Figure 4 shows the DN image at the first read in the data ramp for the second
DCE collected in the positive-rail part of the rail-to-rail test. All pixels were
saturated at the first read in the data ramps. This image shows that Readout 3,
known from ground-test to potentially have a large DC offset on its data ramps,
is indeed subject to that problem post-launch. Readout 5, seen in one instance
to have a small DC offset on its data ramps in ground-test, also has that problem
in these data.
Figure 4. 160 µm array image showing DN at the first read in the data ramp. The top and bottom rows are associated with real pixels; the middle row has been populated with the data from the "engineering pixels". Approximate DN levels (in units of 103 DN) for the 2 readouts with shorts are indicated, as are the offsets from the nominal top rail value of 65535 DN.
In ATLO test it was shown that the positive rail value for readout 3 was correlated
with the 160 µm Board Temperature (D160Temp) in the CE. The temperature of
that board increased from 15.7 C, during the rail-to-rail test, to over 21 C by
the end of the campaign, during the Scattered Background Monitor (mips-950) test.
However, no corresponding variation of the high-rail position for readout 3 was
seen in any of the data, as summarized in Figures 5 and 6.
Figure 5. Average DN for readouts 3 and 5 during the rail-to-rail test. The temperature of the CE board controling the 160 µm array was 15.7 C.
Figure 6. Average DN for readouts 3 and 5 during the Scattered Background Monitor test. The temperature of the CE board controling the 160 µm array ranged from 18.5 C to 20.4 C during the interval shown in this plot.
A 70um photometry test was performed during MIPS campaign A. Telemetry in one of the data files from that test (mips_AOR_6413824_pht_A24_P70_pos1_3s.fits) was evaluated to assess whether the CSMM behavior was as expected. That examination showed the following:
The SSC is aware of all these problems. The keyword unit labels will be fixed. CSM_PRED was supposed to appear in the post-tranhead data, and soon will. The value of CSM_PRED will be changed to a float to avoid the truncation problem.
Other telemetry (indicated that the 70 µm stimulator was flashed on the correct DCEs (STMLF_70 and STMFL160 were 0 except on DCEs 2, 8, 10, and 16 where they were 1), although is was impossible to verify stim flashes in the array data due to the high background). The stim period was set to 20 reads, as it should be. The number of reads in each DCE (DCE_FRMS) was 28, appropriate for the commanded 3 second DCEs w/ a CSMM flyback period of 1/2 second.
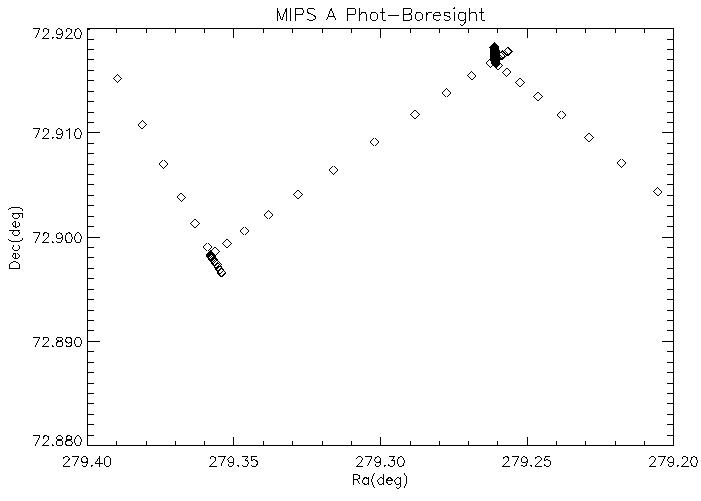
The observatory also executed the nod between the first 1/2 of the photometry
AOR (DCEs 1-8, with stims on 2 and 8) and the 2nd 1/2 (DCEs 9-16, with stims
on 10 and 16). The 2 figures below illustrate the boresight pointing telemetry,
and the AOR visualization from SPOT, and show good agreement between the expected
and the actual pointing behavior.
Figure 7.Boreshight pointing history for the 70um AOR run in Campaign A1. The telescope slews in from the upper left, settles at the pointing for the first 1/2 of the aor (cluster of points at lower left), nods to the second 1/2 of the AOR (cluster of points at upper right), and then slews away. Compare with visualization in Fig. 8.
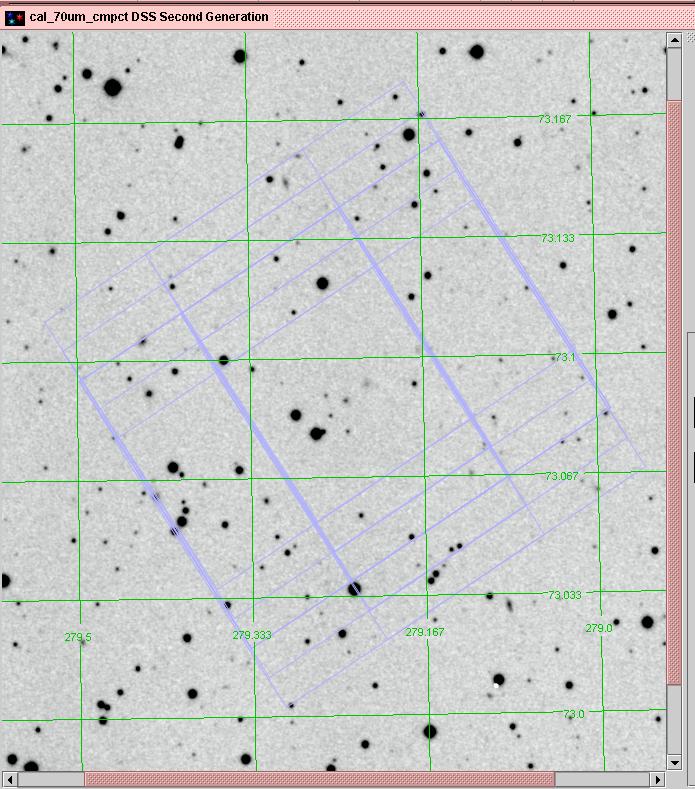
Figure 8.AOR visualization from SPOT. Compare with above.
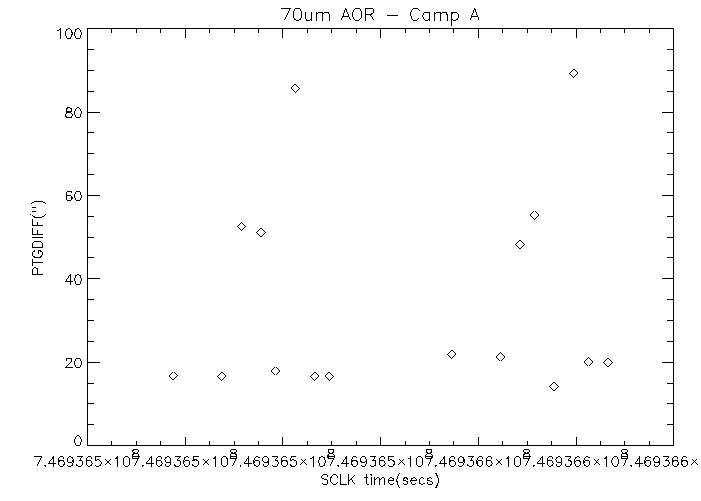
The difference between the "commanded" pointing and the requested pointing
is shown in Figure 9. A constant small difference between the two is the
expected result; the spikey nature of the data in this plot indicates a
problem with the calculation of the commanded position by the ground data
system. This issue is being followed up at the SSC.
Figure 9.The difference between the requested pointing, including CSMM dithers, and what the ground data system thinks the commanded pointing was. The large excursions are probably due to an incorrect CSMM model in the GDS.
MIPS appears to be functioning properly in nearly all ways. The exceptions to this are:
Functions confirmed to be working properly are:
Troubleshooting of the new short on the 70 µm array.